

Introduction
Pulmonary embolism (PE) is a frequent and potentially fatal cardiovascular emergency, especially in the absence of a rapid and accurate diagnosis. Contrast-enhanced CT imaging (CTPA) is the reference method, but it has important limitations related to availability, radiation exposure, and renal toxicity [1]. In this context, rapid and non-invasive tools for initial triage of patients remain essential.
The electrocardiogram (ECG), although present in all emergency services, is often underutilized due to the low sensitivity of isolated findings. However, recent literature shows that composite ECG models, which combine multiple abnormalities, can significantly increase diagnostic accuracy. Su et al. developed an ECG model based on 8 criteria, which showed a sensitivity of 79% and an area under the ROC curve of 0.87 (AUC) in identifying acute PE [2]. Other studies confirm these results, underlining the importance of the added value of right-sided leads and early T wave changes. In the same vein, combined ECG scores have shown superior performance compared to classic clinical scores (Wells, Geneva), especially when integrated with D-dimer [3, 4].
The purpose of this study was to evaluate the diagnostic value of electrocardiographic findings in acute pulmonary embolism by integrating multiple ECG abnormalities into a composite diagnostic score.
Material and methods
This prospective, cross-sectional study was conducted between January 2022 and February 2025 in two hospitals in Chișinău, Republic of Moldova: the Holy Trinity Municipal Clinical Hospital (163 patients) and the Institute of Cardiology (37 patients). The study protocol was approved by the Research Ethics Committee of Nicolae Testemițanu State University of Medicine and Pharmacy, Chișinău, Republic of Moldova (minutes No. 2/25, March 30, 2023).
Participant selection. A total of 200 adult patients with clinical suspicion of acute PE were evaluated, and all underwent CTPA for diagnostic confirmation. The diagnosis was based on PE guideline recommendations [1]. Inclusion criteria: age ≥18 years, clinical suspicion of acute PE, availability of ECG and CTPA results. Differential diagnoses included acute and chronic coronary syndrome, dissecting aneurysm of the aorta, acute abdomen, and acute heart and respiratory failure [5]. Based on CTPA results, acute PE was confirmed in 168 patients, and 32 patients with similar symptoms but no filling defects were assigned to the control group.
Electrocardiographic analysis. All participants underwent a standard 12-lead electrocardiogram upon admission. Based on literature evidence [1-4], a composite ECG score was developed, including 10 criteria known to correlate with PE (Table 1). Each ECG parameter was assigned a score of 1 or 2 points based on its diagnostic weight. The total score ranged from 0 to 12 points, similar in structure to the model proposed by Su et al. [2].
Table 1. Components and scoring of the ECG-based composite score for pulmonary embolism | |
Parameter | Score |
Sinus tachycardia (>100 bpm) | 1 |
Atrial fibrillation | 2 |
T wave inversions in V1–V4 | 1 |
S1Q3T3 triad | 2 |
Qr pattern in V1 | 1 |
Complete right bundle branch block | 1 |
Right axis deviation | 1 |
P pulmonale | 1 |
QTc > 460 ms | 1 |
ST depression in V1–V3 | 1 |
Note: ECG = Electrocardiogram; PE = Pulmonary embolism; QTc = Corrected QT interval; bpm = Beats per minute; V1–V4 = Precordial leads V1 through V4; S1Q3T3 = S wave in lead I, Q wave in lead III, and inverted T wave in lead III; Qr = Q wave followed by a prominent R wave (suggestive of right ventricular conduction); T wave inversion = Negative T waves, typically indicating right ventricular strain. A 10-item ECG score (0–12) was used; ≥5 indicated high PE probability. | |
Electrocardiographic score interpretation. Patients were categorized into risk classes as follows: 0-3 points – low probability, 4-6 points – intermediate probability, and ≥7 points – high probability (recommendation for immediate imaging).
Statistical analysis. All statistical analyses were performed using IBM SPSS v26.0. Continuous variables were expressed as mean ± SD, and categorical variables as counts and percentages. Comparisons between groups used the chi-square test. To assess the diagnostic performance of the ECG score (cutoff ≥5), the following metrics were calculated: sensitivity, specificity, positive predictive value (PPV), negative predictive value (NPV), accuracy, positive and negative likelihood ratios (LR⁺, LR⁻), post-test probabilities, receiver operating characteristic (ROC) curve, and area under the curve (AUC).
Results
Analyzing the distribution of ECG abnormalities, such as T wave inversions in V1-V4, S1Q3T3 triad, atrial fibrillation, and right axis deviation, showed that they were much more frequent in the acute PE group, supporting their diagnostic value (Table 2).
Table 2. Frequency of individual ECG abnormalities in patients with and without pulmonary embolism | ||||
ECG Finding | PE (n = 168) | Non-PE (n = 32) | PE (%) | Non-PE (%) |
Sinus rhythm | 110 | 28 | 65.5% | 87.5% |
Atrial fibrillation | 47 | 2 | 28.0% | 6.2% |
Bundle branch block | 19 | 2 | 11.3% | 6.2% |
S1Q3T3 triad | 36 | 1 | 21.4% | 3.1% |
P pulmonale | 32 | 1 | 19.0% | 3.1% |
Right axis deviation | 31 | 1 | 18.5% | 3.1% |
Qr in V1 | 37 | 2 | 22.0% | 6.2% |
R/S ratio > 1 in V1 | 26 | 1 | 15.5% | 3.1% |
Negative T waves in V1–V4 | 72 | 2 | 42.9% | 6.2% |
ST depression in V1–V3 | 44 | 1 | 26.2% | 3.1% |
QTc > 440 ms | 33 | 1 | 19.6% | 3.1% |
Note: Data are presented as absolute frequencies and percentages. ECG = Electrocardiogram; PE = pulmonary embolism; QTc = Corrected QT interval; n = number of patients with the corresponding finding. % = proportion relative to the total number of patients in each group (PE: n = 168; Non-PE: n = 32). | ||||
The comparative analysis of ECG criteria between patients with and without acute PE revealed significant differences in the frequency of electrocardiographic abnormalities. Classic changes associated with PE, such as negative T waves in leads V1-V4 (42.9% vs. 6.2%), the S1Q3T3 triad (21.4% vs. 3.1%), and right axis deviation (18.5% vs. 3.1%), were considerably more frequent in the acute PE group, suggesting important predictive value. Atrial fibrillation was also almost five times more prevalent in PE patients (28% vs. 6.2%). Sinus rhythm was predominant in the non-PE group (87.5%), which supports the idea that the presence of arrhythmias or significant conduction deviations may raise suspicion of PE. Other signs, such as ST segment depression in V1-V3, Qr in V1, and prolonged QTc, were also more frequent in the acute PE group, but with relatively lower specificity. These findings confirm that certain combinations of ECG signs can add clinical value in supporting the diagnosis of acute PE and may guide prioritization of imaging studies, especially in resource-limited settings.
Table 3. Frequency of combined ECG abnormalities in patients with and without pulmonary embolism | ||||
ECG Combination | Patients with PE (n = 168) | Patients without PE (n = 32) | PE % | Non-PE % |
S1Q3T3 + negative T waves in V1–V4 | 34 | 1 | 20,2% | 3,1% |
Atrial fibrillation + negative T in V1–V4 | 27 | 2 | 16,1% | 6,2% |
Bundle branch block + negative T in V1–V4 | 20 | 1 | 11,9% | 3,1% |
Qr in V1 + negative T in V1–V4 | 24 | 2 | 14,3% | 6,2% |
S1Q3T3 + right axis deviation | 17 | 1 | 10,1% | 3,1% |
Note: ECG = Electrocardiogram; PE = pulmonary embolism; ECG Combination refers to the simultaneous presence of two electrocardiographic abnormalities observed in the same patient, used to assess their joint diagnostic value for pulmonary embolism. | ||||
The analysis of associations between two ECG criteria (Table 3) showed that certain combinations are significantly more frequent among patients with acute PE than among those without PE, suggesting increased diagnostic value in the concurrent presence of multiple electrocardiographic signs. The most prevalent combination was S1Q3T3 + negative T waves in V1–V4, found in 20.2% of patients with acute PE, compared to only 3.1% of patients without acute PE, highlighting its possible specific character. Additionally, the combinations between atrial fibrillation and negative T waves (16.1% vs. 6.2%) or bundle branch block and negative T waves (11.9% vs. 3.1%) were also much more frequent in the acute PE group, suggesting a link between these changes and the severity of cardiopulmonary impairment. The combination of negative T waves with Qr in V1 or right axis deviation also showed a clear difference between the groups, supporting the idea that multiple ECG changes increase the pre-test probability of acute PE. These findings support the use of composite ECG scores and could guide the development of predictive algorithms that consider the coexistence of multiple ECG changes rather than evaluating them in isolation.
Table 4. Statistical significance of ECG combinations | ||
ECG Combination | χ² | p-value |
S1Q3T3 + negative T waves in V1–V4 | 4.33 | 0.0374 |
Atrial fibrillation + negative T in V1–V4 | 1.37 | 0.2411 |
Bundle branch block + negative T in V1–V4 | 1.37 | 0.2419 |
Qr in V1 + negative T in V1–V4 | 0.91 | 0.3411 |
S1Q3T3 + right axis deviation | 0.87 | 0.3523 |
Note: ECG = Electrocardiogram; χ² = chi-square statistic; p-value = probability value. | ||
The only combination with a statistically significant difference (Table 4) between patients with and without PE was: “S1Q3T3 + negative T waves in V1-V4”, reinforcing its value as a high-specificity composite ECG indicator. Among the combinations analyzed, only the association “S1Q3T3 + negative T waves in V1-V4” showed a statistically significant difference between patients with and without pulmonary embolism (p = 0.0374), supporting its potential as a composite ECG marker with increased predictive value.
Table 5. Performance of the ECG score | |
Indicator | Value (%) |
Sensitivity | 89.9% |
Specificity | 93.8% |
Positive Predictive Value (PPV) | 98.7% |
Negative Predictive Value (NPV) | 63.8% |
Overall Accuracy | 90.5% |
Positive Likelihood Ratio (LR⁺) | 14.38 |
Negative Likelihood Ratio (LR⁻) | 0.11 |
F1 Score | 94.2% |
Note: The ECG score was considered positive at a threshold ≥5. ECG = Electrocardiogram; PE = pulmonary embolism. | |
The analysis of the performance of the composite ECG score (Table 5), applied to a cohort of 200 patients (168 with confirmed acute PE and 32 without PE), showed a sensitivity of 89.9% and a specificity of 93.8%, indicating an excellent ability to correctly identify patients with acute PE, as well as to exclude unconfirmed cases. The high PPV of 98.7% confirms that an ECG score ≥5 is strongly associated with the presence of acute PE and may justify initiating treatment even in the absence of immediate imaging. The overall accuracy of 90.5% reveals the robustness of this score in clinical contexts. The positive likelihood ratio (LR⁺) of 14.38 indicates a significant increase in post-test probability of acute PE, while the negative LR⁻ of 0.11 supports the utility of the score in ruling out the diagnosis when values fall below the threshold. Lastly, the F1 score of 94.2%, which combines sensitivity and PPV, reflects an optimal balance between detecting true cases and avoiding overdiagnosis (Fig. 1).
|
Fig. 1 Box-Whisker Plot showing the variability in diagnostic performance metrics of ECG criteria for PE. Note: The Y-axis represents percentage values (%), and each box indicates the distribution of sensitivity, specificity, positive predictive value (PPV), negative predictive value (NPV), and accuracy. Boxes indicate interquartile ranges; whiskers represent variability; central lines indicate medians. |
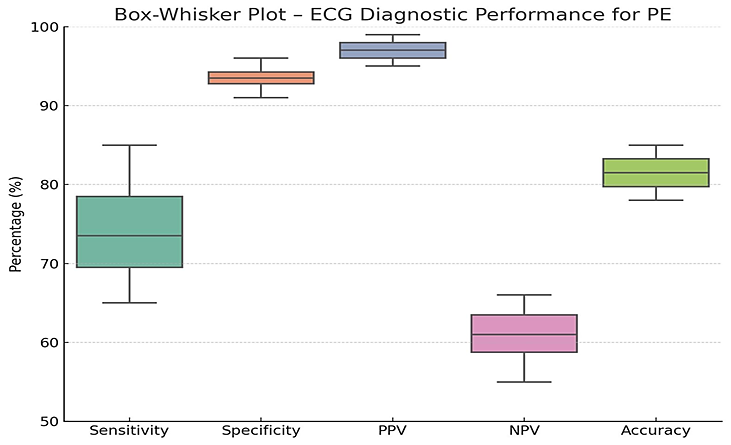
The plot underlines that specificity and PPV are higher and more stable, while sensitivity and NPV show lower values and greater dispersion. A Receiver Operating Characteristic (ROC) curve was generated to evaluate the diagnostic performance of the composite ECG score for acute pulmonary embolism (Fig. 2).
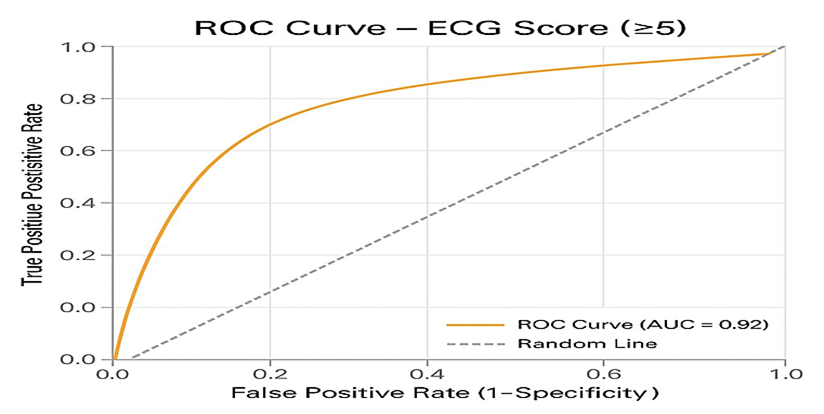 |
Fig. 2 ROC curve for the ECG composite score (threshold ≥5), illustrating its diagnostic performance in discriminating between patients with and without pulmonary embolism. Note: The Y-axis represents the true positive rate (sensitivity), and the X-axis represents the false positive rate (1 – specificity). |
The analysis yielded an AUC of 0.92, indicating excellent discriminative ability of the ECG score (cutoff ≥5) in distinguishing patients with and without acute PE. The ROC curve demonstrated a steep rise toward the upper-left corner, reflecting high sensitivity with a relatively low false-positive rate.
Discussion
The rapid diagnosis of pulmonary embolism (PE) remains a major challenge in clinical practice, particularly in settings where imaging is not immediately available. Our study helps to fill an important gap in the current literature by demonstrating that the use of a composite ECG score ≥5 provides significant diagnostic value and practical utility in the initial triage of patients with suspected acute PE.
Our findings confirm that certain combinations of electrocardiographic changes, such as S1Q3T3 combined with negative T waves in V1-V4, have greater predictive value compared to isolated signs. While these changes are not exclusive to PE, their simultaneous presence suggests acute right ventricular overload, supporting the pathophysiological hypothesis that PE produces sudden strain on the right heart chambers, which is reflected in distinct ECG changes [6].
The ROC value of 0.92 for the ECG score demonstrates excellent discriminative capacity, surpassing the performance previously reported for individual ECG scores or isolated models (e.g., the Daniel score) [2]. A sensitivity of 89.9% and a specificity of 93.8% support the clinical applicability of this model in settings with limited access to imaging or in cases of hemodynamic instability.
Moreover, the positive predictive value of 98.7% suggests that a score ≥5 may justify early initiation of treatment, including anticoagulation, even before tomographic confirmation – potentially reducing the risk of major complications or death.
By integrating multiple ECG parameters with pathophysiological relevance, the proposed score offers a more “global” assessment of right ventricular dysfunction, overcoming the limitations of isolated ECG signs. This multidimensional approach has the potential to be used as a pretest algorithm, enhancing rapid clinical decision-making, particularly in overcrowded emergency departments [2-4].
Nevertheless, it is important to emphasize that ECG should not be seen as a substitute for CT angiography, but rather as a supportive tool that can contribute to risk stratification – especially when combined with other tools such as the Wells score, D-dimer levels, or echocardiography [1].
Conclusions
The ECG composite score ≥5 demonstrates excellent diagnostic utility for acute pulmonary embolism and may serve as a rapid, noninvasive triage tool in emergency settings. Its high discriminatory capacity, supported by sensitivity, specificity, and likelihood ratios, validates its integration into early clinical decision-making. Compared to isolated ECG signs or traditional scores, the composite ECG approach offers an objective advantage in identifying right ventricular strain. Future validation in larger, multicenter cohorts is warranted to confirm its applicability in diverse clinical environments.
Competing interests
None declared.
Authors’ contributions
DR – conceived the study design and performed the statistical analysis, CT – participated in the diagnosis and treatment of patients with pulmonary embolism, SM – reviewed the work critically, NC – participated in the study design and critically reviewed the work. All the authors approved the final version of the manuscript.
Ethics approval
The study protocol was approved by the Research Ethics Committee of Nicolae Testemițanu State University of Medicine and Pharmacy, Chișinău, Republic of Moldova (minutes No. 2/25, March 30, 2023).
Patient consent
Obtained.
Acknowledgements and funding
No external funding.
Provenance and peer review
Not commissioned, externally peer reviewed.
Authors’ ORCID IDs
Doina Ranga – https://orcid.org/0009-0007-1345-4975
Cornelia Talmaci – https://orcid.org/0000-0002-5603-2277
Sergiu Matcovschi – https://orcid.org/0000-0003-1623-930X
Natalia Caproș – https://orcid.org/0000-0001-7283-8468
References
Konstantinides SV, Meyer G, Becattini C, Bueno H, Geersing GJ, Harjola VP, et al. 2019 ESC Guidelines for the diagnosis and management of acute pulmonary embolism. Eur Heart J. 2020;41(4):543-603. doi: 10.1093/eurheartj/ehz405.
Su XF, Fan N, Yang XM, et al. A novel electrocardiography model for the diagnosis of acute pulmonary embolism. Front Cardiovasc Med. 2022;9:825561. doi: 10.3389/fcvm.2022.825561.
Simon A, Ámon T, Baracsi-Botos V, Pálfi T, Szőke VB, Püspöki Z, et al. Acute pulmonary embolism pretest probability estimation by D-dimer , our modified, new ECG score and clinical prediction rules. Heliyon. 2024;10(17):e36326. doi: 10.1016/j.heliyon.2024.e36326.
Jahanian S, Ayati A, Hosseini K, et al. Right-sided electrocardiogram in patients with acute pulmonary embolism. Crit Pathw Cardiol. 2022;21(1):24-29. doi: 10.1097/HPC.0000000000000273.
Caproș N, Dumitraş T, Nichita S, Draguța N, Vlasov L, Corlăteanu O. Diferential diagnosis in internal medicine. Chisinau: [s. n.]; 2019. 447 p. ISBN 978-9975-56-705-3.
Krintratun S, Srichuachom W, Wongtanasarasin W. Prevalence of electrocardiographic abnormalities in patients with acute pulmonary embolism: a systematic review and meta-analysis. J Clin Med. 2025;14(13):4750. doi: 10.3390/jcm14134750.