
Introduction
Spironolactone is a selective and competitive antagonist of aldosterone, due to its structural similarity to aldosterone. Chemically, spironolactone is 7α-acetylthio-3-oxo-17α-pregn-4-ene-21,17-carbolactone (Figure 1). Spironolactone works by competing with aldosterone for interactions with aldosterone receptors in the collecting duct. This antagonistic effect increases the excretion of water and sodium while decreasing the excretion of potassium (K+ sparing diuretic) [1]. Unfortunately, spironolactone works slowly, requiring several days to develop its pharmacologic action, and similarly, its effect diminishes slowly [1].
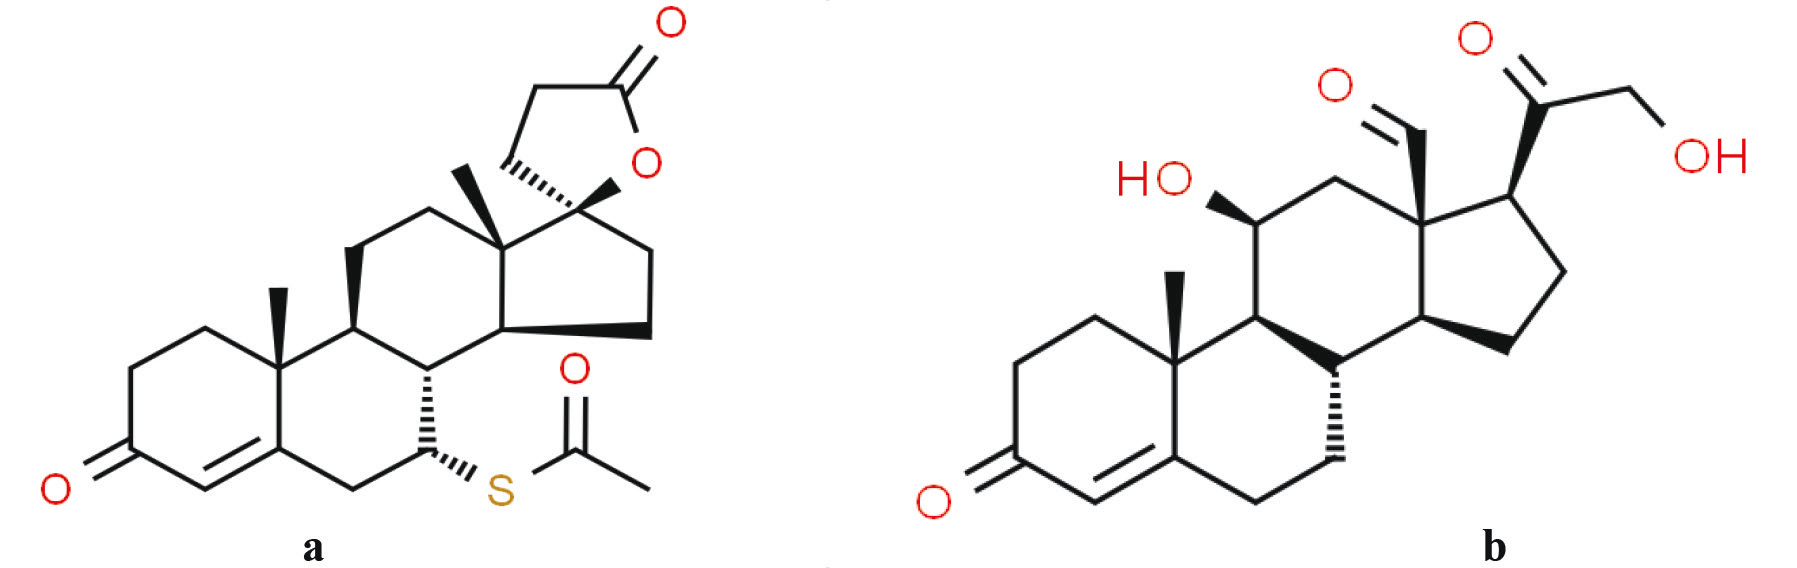 |
Fig. 1 Chemical structure of spironolactone (a) and aldosterone (b) [2, 3]. Data from http://www.chemspider.com/Chemical-Structure.5628.html Data from http://www.chemspider.com/Chemical-Structure.5633.html |
To expand the portfolio of effective and harmless potassium-containing products with mechanisms of action at the molecular level, a new composition was developed, consisting of potassium orotate (OK), potassium and magnesium aspartate (AsMg, AsK). Excipients were included in the pharmaceutical form to improve technological parameters for facilitating the manufacturing process, as well as to enhance stability, bioavailability, and efficacy of the final medicine. Moreover, a validated method is necessary to analyze spironolactone in various dosage forms, such as suspension (5mg/ml), tablets (25mg), capsules (50mg), and the newly developed powder. The developed assay method was validated according to International Conference on Harmonization (ICH) Guidelines and was successfully employed for the analysis of spironolactone in pharmaceutical dosage forms, based on analytical performance characteristics: Linearity, Precision, Accuracy, Ruggedness, Low Limit of Detection (LOD), and Low Limit of Quantitation (LOQ) [4-8]. The validatedassay methods allow for the testing of spironolactone in stability studies, using stress-factors such as acid, base, temperature, light, oxidizing agents, and susceptibility across a range of pH values, as well as dissolution testing.
The aim of this study was to develop a simple, sensitive, accurate, precise, and low-cost UV-spectrophotometric assay method for estimating spironolactone (S) in a combined powder that also contains potassium orotate (OK), potassium and magnesium aspartate (AsMg, AsK), and auxiliary substances.
Materials and methods
The method was validated according to International Conference on Harmonization (ICH) guidelines.
A single beam Ultraviolet-Visible spectrophotometer (Agilent 8453, USA) with 10.0 mm matched quartz cells was used. All absorbance measurements were carried out at 25±1ºC and at 238±2nm. All weights were taken on an electronic balance (Model Radwag), and the samples were sonicated using an ultrasonic bath (Sapfir).
Potassium aspartate, magnesium aspartate, and potassium orotate (Sigma-Aldrich), spironolactone (Acros Organic and European Pharmacopoeia Reference Standard), and auxiliary substances such as microcrystalline cellulose, lactose monohydrate (Himedia), and stearic acid (Chem-Lab), as well as analytical grade reagents and solvents (Chem-Lab), were used to carry out the study.
Preparation of the test sample
Twenty powders were mixed, weighed, and the average weight of each powder was determined. The mass of one powder (approximately 1.991 mg) was weighed and placed into a 25-ml volumetric flask. Approximately 10 ml of methanol was added, and the mixture was ultrasonicated for a minimum of 15 seconds before being made up to the mark with methanol. The sample was filtered through filter paper; 1 ml of this solution was transferred to a 10-ml volumetric flask and made up to the mark with methanol, resulting in a concentration of 10 μg/ml. Three series of final sample solutions were analyzed by UV spectrophotometry at 238 nm and calculated according to the Formula 1:
(1)
(1)
Apr – the mean value of 3 series of absorbance of sample solutions;
Ast – the mean value of 3 series of absorbance of standard solutions;
mpr – mass of sample substance, g;
mst – mass of standard substance, g;
P – standard substance content, %;
Vpr and Vst – volumes of sample and standard solutions, respectively.
Preparation of standard stock solution
A spironolactone standard stock solution containing 100 µg/ml was prepared in a 25-ml volumetric flask by dissolving 2.5 mg of spironolactone reference standard in methanol. The solution was sonicated for a minimum of 15 seconds and then made up to the mark with methanol. Three series of standard solutions were analyzed by UV spectrophotometry at 238 nm and calculated using Formula 1.
Preparation of placebo solution
The auxiliary ingredients were weighed in quantities necessary to prepare 20 powders, mixed, and homogenized in a mortar. About 1.528 mg was weighed and placed into a 25-ml volumetric flask. About 10 ml of methanol was added, and the mixture was ultrasonicated for a minimum of 15 seconds before being made up to the mark with methanol. The sample was filtered through filter paper; 1 ml of this obtained placebo solution was transferred to a 10-ml volumetric flask and made up to the mark with methanol. It was then analyzed by UV spectrophotometry.
Validation method
Linearity
Standard solutions at five different concentrations were prepared and analyzed for linearity studies to determine the linearity within the concentration range by calculating linear regression equations and regression coefficient values (Pearson, R2). Linearity test solutions were prepared at levels from 50 to 300% of assay analyte concentration (5, 10, 15, 20, and 30 μg/ml). Each solution was prepared in triplicate.
Preparation of standard calibration curves: Aliquots of 0.5 ml, 1 ml, 1.5 ml, 2 ml, and 3 ml from the spironolactone standard stock solution were placed into 10-ml volumetric flasks and diluted to 10ml with methanol to obtain final concentrations of spironolactone at 5 μg/ml, 10 μg/ml, 15 μg/ml, 20 μg/ml, and 30 μg/ml, respectively. The obtained standard solutions were analyzed at 238 nm using a spectrophotometer, with methanol as a blank. The graphs were plotted with the concentration of standard spironolactone against the response (absorbance).
Limits of detection and limits of quantification
The limit of detection (LOD) is the lowest concentration of an analyte in a sample that can be detected, while the limit of quantification (LOQ) is the lowest concentration of an analyte in a sample that can be quantitated. Both LOD and LOQ were experimentally verified and calculated using the following equation: LOD = 3.3 (SD/Slope) and LOQ = 10 (SD/Slope).
Precision
The precision of the method was evaluated through repeatability and intermediate precision, according to intra-day and inter-day precision, and reported as percent relative standard deviation (%RSD ≤ 2). The repeatability precision was analyzed by performing six spironolactone test sample preparations made on the same day (intra-day). Intermediate precision was evaluated by 2 analysts performing the same procedure on a different day (inter-day) under the same experimental conditions.
Accuracy
The accuracy of the assay method was evaluated through a recovery study by adding a known amount of spironolactone standard to a pre-analyzed test sample solution at 3 different concentrations: 80%, 100%, and 120%. Various concentrations of standard spironolactone solutions of 6, 10, and 14 μg/ml were added to a fixed concentration of test sample solution (10 μg/ml) in a 1:1 ratio.
Robustness
The robustness of the method was determined by analyzing the sample solution (10 μg/ml) at two different wavelengths (± 4 nm) and by a single analyst performing the analysis on two different instruments, while maintaining other spectrophotometric conditions constant. The effect of these changes was studied based on the percent recovery and standard deviation of spironolactone.
The specificity of the method was assessed by evaluating the spectra of the placebo solution (containing all the excipients of the powder except the active ingredients) to confirm the lack of interference or overlap with Spir at the analytical wavelength.
Results
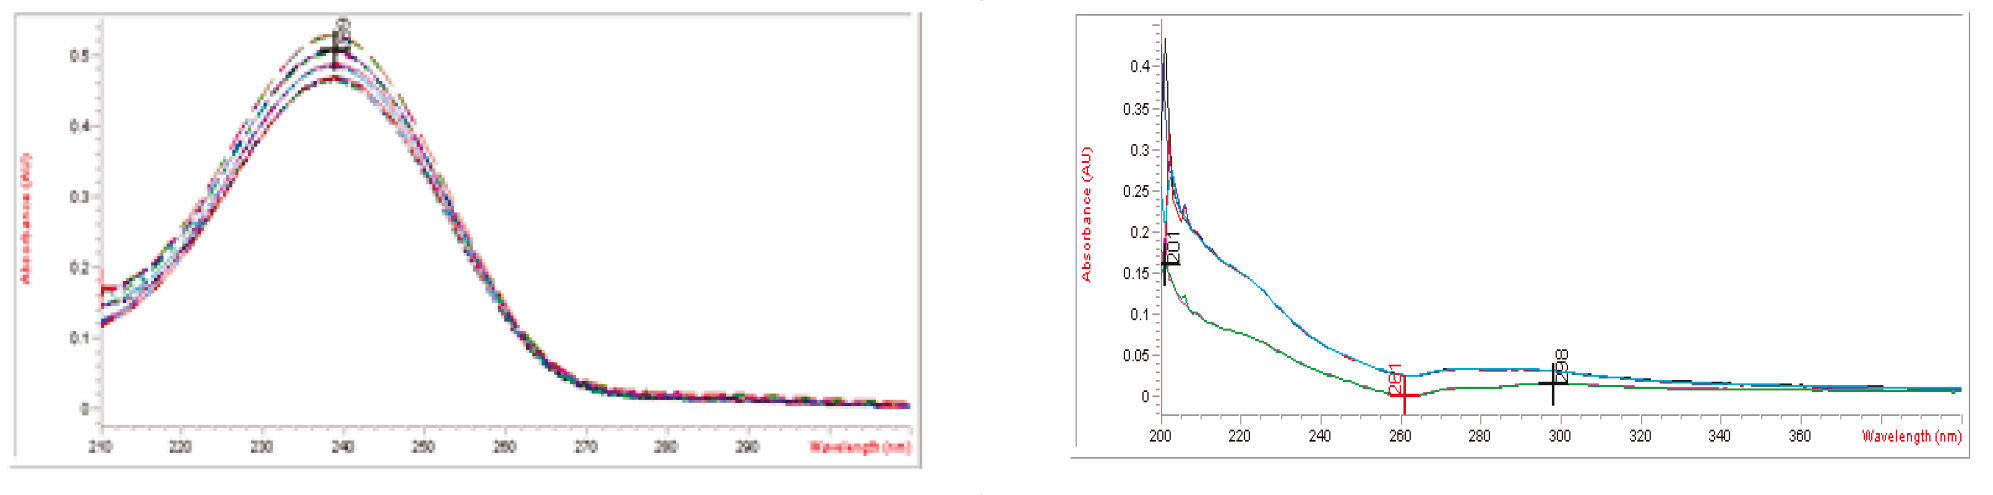
The assay method for spironolactone in pharmaceutical forms was developed and validated according to ICH Guidelines in terms of linearity, accuracy, precision, LOD, LOQ, and robustness. Analyses were conducted using a UV-visible single-beam spectrophotometer (Model: Agilent 8453) at a wavelength of 238±2 nm, with methanol as the blank. The results are shown in Figure 2.
 | |
1 | 2 |
Fig. 2 Ultraviolet absorbtion spectra of spironolactone sample (1) and placebo (2) | |
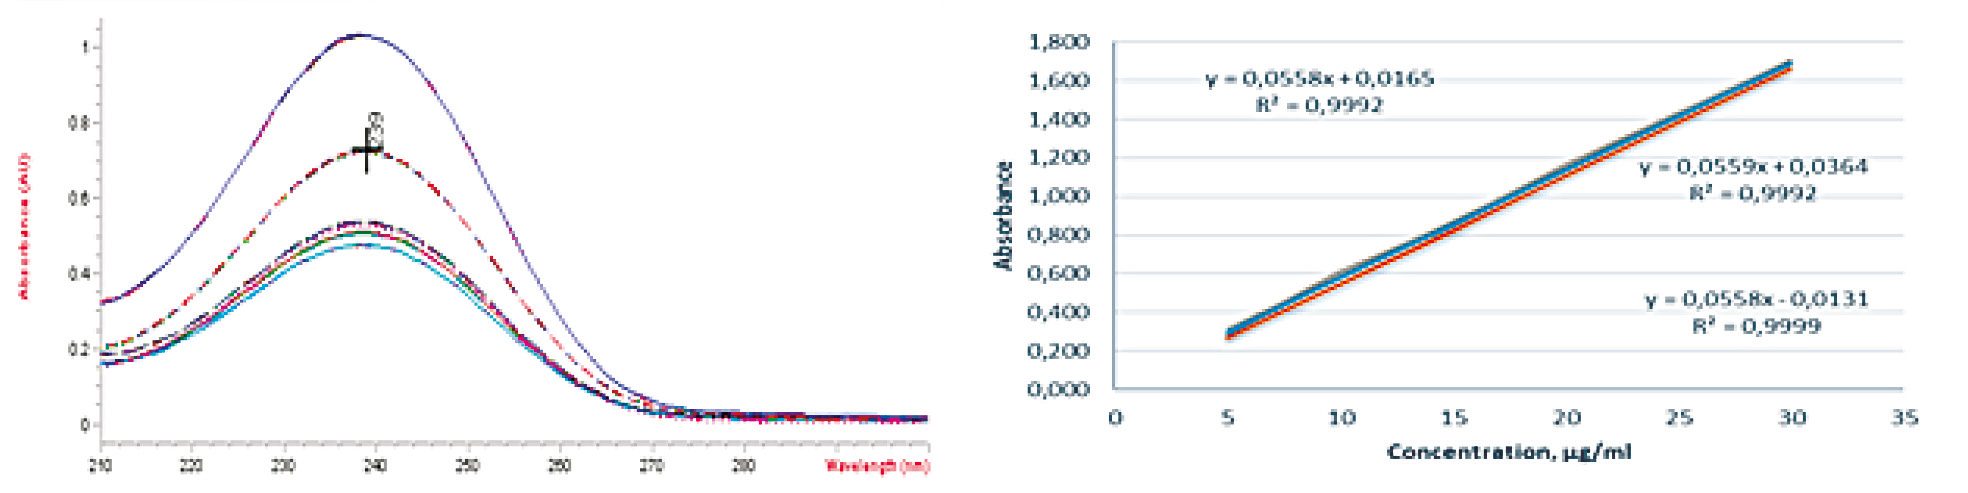
Linearity test solutions were prepared at 5 concentration levels, ranging from 50 to 300% of the assay analyte concentration (5, 10, 15, 20, and 30 μg/ml), and repeated 3 times (Tab.1). Linearity was established over the concentration range of 5-30 μg/ml for spironolactone. The linear regression equation was found to be: y = 0.0558x + 0.022, with an R2 of 0.9994. The y-intercept (constant of regression) was 0.022, and the slope (coefficient of regression) was 0.0558. The results are represented in Figure 3.
Table 1. Calibration data for spironolactone spectrophotometric determination | ||||||
Ast_1 | Ast_2 | Ast_3 | Ast_4 | Ast_5 | Axmed | |
| 5 μg/ml | 0.279 | 0.280 | 0.279 | 0.283 | 0.279 | 0.280 |
| 10 μg/ml | 0.596 | 0.595 | 0.595 | 0.596 | 0.595 | 0.595 |
| 15 μg/ml | 0.844 | 0.844 | 0.845 | 0.845 | 0.844 | 0.845 |
| 20 μg/ml | 1.145 | 1.146 | 1.144 | 1.146 | 1.145 | 1.145 |
| 30 μg/ml | 1.673 | 1.673 | 1.688 | 1.698 | 1.698 | 1.686 |
Note: Ast-- Absorbance of the spironolactone standard solution at different concentrations | ||||||
 | |
1 | 2 |
Fig. 3 Ultraviolet spectra of standard solutions of spironolactone at different concentrations (1) and calibration curves for 3 series of determinations (2) | |
The determined LOD of spironolactone (0.5 μg/ml) and LOQ (1.4 μg/ml) showed the sensitivity of the method.
Precision was assessed by integrating the absorbance of a 10μg/ml test solution in six replicates on the same day and over multiple days, repeated 3 times. The precision studies showed that the % relative standard deviation was within acceptable limits (RSD < 2). The results are shown in Tables 2 and 3.
Table 2. Results of the repeatability precision for the assay of spironolactone | ||
Run | Absorbance | Amount found, % |
1 | 0.5261 | 100.4 |
2 | 0.5259 | 100.4 |
3 | 0.5275 | 100.7 |
4 | 0.5275 | 100.7 |
5 | 0.5273 | 100.6 |
6 | 0.52686 | 100.6 |
Mean | 0.527 | 100.6 |
RSD, % | 0.13 | 0.13 |
Note: RSD - Relative standard deviation | ||
Table 3. Results of the intermediate precision for the assay of spironolactone | ||||||
Intra-day | Inter-day | |||||
| Run | Absorbance of the 1st analyst | Amount found, % | Absorbance of the 2nd analyst | Amount found, % | Absorbance of the 1st analyst | Amount found, % |
1 | 0.5261 | 100.4 | 0.5273 | 100.6455 | 0.5259 | 100.4 |
2 | 0.5259 | 100.4 | 0.5269 | 100.5691 | 0.5287 | 100.8 |
3 | 0.5275 | 100.7 | 0.5267 | 100.531 | 0.5274 | 100.7 |
4 | 0.5275 | 100.7 | 0.5274 | 100.6646 | 0.5295 | 101.1 |
5 | 0.5273 | 100.6 | 0.527 | 100.5882 | 0.5279 | 100.8 |
| Mean | 0.527 | 100.6 | 0.5 | 100.6 | 0.5 | 100.7 |
| RSD, % | 0.15 | 0.15 | 0.05 | 0.05 | 0.25 | 0.25 |
Note: RSD - Relative standard deviation | ||||||
The accuracy of the developed method was determined by adding standard solutions (6, 10, and 14 μg/ml) to a fixed concentration of test sample solution (10 μg/ml). Accuracy was evaluated at 80%, 100%, and 120% levels of the standard solution (SD). The mean percentage recovery was calculated, and the results are shown in Table 4.
Table 4. Results of the accuracy for the assay of spironolactone | ||||||
Spiked Level (%) | Amount of Spir from taken sample (μg/ml) | Amount of Spir added standard (μg/ml) | Total amount of Spir (μg/ml) | Amount found of Spir from taken sample (μg/ml) ±SD | Recovery, % | RSD, % |
80 | 10 | 6 | 8 | 9.99±0.08 | 99.9 | 0.82 |
100 | 10 | 10 | 10 | 10.07±0.12 | 100.7 | 1.23 |
120 | 10 | 14 | 12 | 10.17±0.17 | 101.7 | 1.67 |
Note: RSD - Relative standard deviation, Spir - spironolactone | ||||||
The robustness of the method and the influence of deliberate variations in the analytical parameters on the absorbance of Spir were examined. Parameters such as the analytical wavelength (238 ± 4 nm) and the type of instrument were modified. The test solution of 10 µg/ml Spir was applied to this parameter It was determined that these changes in the spectrophotometric determination conditions did not result in changes in the quantitative content of Spir, confirming that the developed method is robust. The results are reported in Table 5.
Table 5. Results of the robustness for the assay of spironolactone | ||||
Parameter | RSD, % | Assay, mg | Assay, % | |
Wavelength | 234 nm | 0.17 | 23.68 | 100.8 |
238 nm | 0.15 | 24.14 | 100.6 | |
242 nm | 0.07 | 23.69 | 99.1 | |
Instrument | Agilent 8453 | 0.15 | 24.14 | 100.6 |
Shimadzu 1800 UV | 0.13 | 24.64 | 102.68 | |
Note: RSD - Relative standard deviation, Spir - spironolactone | ||||
In the presence of common excipients such as microcrystalline cellulose, lactose monohydrate, and stearic acid, no interferences were observed (Figure 2). This confirms the specificity of the developed method.
Discussions
In this study, a validated method was developed for the analysis of spironolactone from a new compound powder containing spironolactone, potassium orotate, potassium and magnesium aspartate, and excipients. This combination of active pharmaceutical substances is specific and can be successfully applied for the treatment of hypopotassemia. According to other reported studies, different solvents (such as ethanol, methanol, acetonitrile) and wavelengths have been used to analyze spironolactone from other medicines by UV-Vis spectrophotometry. Based on the performed analyses, we selected the most satisfactory conditions to validate the method in compliance with ICH guidelines for specificity, linearity, precision, accuracy, and robustness. This method can be applied for routine quality control, quantitative analysis, and stress stability testing. The UV-Vis spectrophotometric method for the analysis of spironolactone from the compound powder was developed for the first time and demonstrated good accuracy, precision, LOD, LOQ, robustness, and specificity. The results of the analysis were statistically validated using SPPS, and the RSD (%) values for all measurements were less than 2.
Conclusion
The proposed UV-Vis spectrophotometric method was found to be simple, rapid, precise, and low-cost. Validated according to ICH guidelines, the method demonstrated excellent linearity, accuracy, precision, LOD, LOQ, robustness, and specificity. This new analytical method was developed for the routine simultaneous determination of spironolactone in the presence of OK, AsK, and AsMg in the newly developed pharmaceutical form – combined powder.
Competing interests
The author declares that there is no conflict of interest in the manuscript.
Acknowledgements and funding
The research was conducted at the Scientific Center for Drug Research within Nicolae Testemițanu State University of Medicine and Pharmacy. The study was initiated by the author.
Authors’ contributions
EM conducted the literature review, wrote the manuscript, revised the final text, and approved the final version of the manuscript.
Ethics approval
Not needed for this study
Author’s ORCID ID:
Ecaterina Mazur – https://orcid.org/0000-0003-0725-8410
References
Ghicavîi V, Bacinschi N, Gușuilă G. Farmacologie [Pharmacology]. 3rd ed. Chișinău: Print Caro; 2019. 1000 p. Romanian.
ChemSpider. Spironolactone: chemical structure [Internet]. London: Royal Society of Chemistry; 2024- [cited 2024 Apr 5]. Available from: http://www.chemspider.com/Chemical-Structure.5628.html
ChemSpider. Aldosterone: chemical structure [Internet]. London: Royal Society of Chemistry; 2024- [cited 2024 Apr 5]. Available from: http://www.chemspider.com/Chemical-Structure.5633.html
International Conference on Harmonization Expert Working Group. Validation of analytical procedures: text and methodology Q2(R1): ICH Harmonised Tripartite Guideline [Internet]. Geneva: ICH; 2005 [cited 2024 Apr 5]. Available from: https://database.ich.org/sites/default/files/Q2%28R1%29%20Guideline.pdf
Uncu L, Donici E, Valica V, Vîslouh O, Gonciar V, Parii S. Development and validation of an assay method for ciprofloxacin hydrochloride determination in combination ear drops. Chem J Mold. 2019;14(2):56-61. https://doi.org/10.19261/cjm.2019.607.
Prajapati P, Chandarana C, Modi V, Basuri T. Quantification of Spironolactone by first and second order UV Derivative Spectrophotometry in bulk and tablet dosage form. Int J Pharm Chem Anal. 2016:3(3):168-173.doi: 10.5958/2394-2797.2016.00024.1.
Chaudhary A, Vadalia KR, Thummer P. Development and validation of ratio derivative spectrophotometric for simultaneous estimation of metolazone and spironolactone in pharmaceutical dosage form. Int J Pharm Sci Res. 2012;3(10):3999-4003.
US Food and Drug Administration. Guidance for industry: Bioanalytical method validation, 2001 [Internet]. Washington: FDA; 2001 [cited 2024 Apr 5]. Available from: http://www.fda.gov/downloads/Drugs/Guidance/ucm070107.pdf