
Introduction
Chronic liver diseases (CLD) contribute to a major burden to both morbidity and mortality worldwide with a significant impact on public health. Fatty liver disease (FLD) is composed of a wide spectrum of disorders including alcoholic liver disease (ALD) and metabolic associated fatty liver disease (MAFLD). Metabolic associated fatty liver disease is estimated to affect 25% of the world's population and encompasses a spectrum of liver disease that ranges from simple steatosis (SS) to steatohepatitis and cirrhosis [1].
Cardiovascular disease (CVD) is the leading cause of mortality in this group [2], followed by non-liver cancer and liver-related complications. Because of the underlying metabolic disorder, MAFLD patients are expected to have a higher risk of vascular and coronary heart disease as well. Cardiovascular disease dictates the outcome (or outcomes) in patients with MAFLD more frequently and largely than does the progression of liver disease.
In order to reduce the CVD mortality rate, some preventive measures of “at high risk” individuals are necessary. CVD risk prediction models are ideal for recognizing and treating high-risk populations [3]. Many risk estimation systems are in existence for improving the management of population groups, such as Framingham risk score (RiskFRS) and the American Heart Association (AHA) and the American College of Cardiology (ACC) score (Risk ACC/AHA) and the SCORE (Systematic COronary Risk Evaluation) (Risk SCORE) [4-6]. Currently, none of the available risk prediction models are authenticated in patients with hepatic steatosis.
The aim of this study was to measure the cardiovascular risk profile of the cohort of hepatic steatosis cases and to compare different 10-year CVD risk assessment models (RiskFRS, Risk ACC/AHA and RiskSCORE) in this populational group.
Material and methods
Study population
The transversal, observational, prospective, case control study was included 680 consecutive patients (403 males and 277 females) with MAFLD attending the Hepatology unit of Republican Clinical Hospital, Unit of Ischemic Hard Disease of Institute of Cardiology, Unit of Cardiology of Hospital of Ministry of Health, Kishinev and 96 control subjects without MAFLD (37 males and 59 females).
All patients underwent a complete clinical and anthropometric evaluation, and a routine liver ultrasonographic scan. At the time of enrolment: demographic (gender, age, ethnicity, smoking habit), anthropometric (body mass index, waist circumference) and biochemical data (liver function tests, full blood count, fasting lipids) were recorded. Smoking‐level was categorized as (a) nonsmokers, (b) ex‐smokers, (c) smokers [7].
The subjects were interviewed to obtain their history of hypertension, diabetes mellitus, dyslipidemia, myocardial infarction, stroke, as well as alcohol consumption and smoking. Family history of diabetes (first- and second- degree relatives) and of cardiovascular disease (first-degree relatives: males younger than 55 years, females younger than 60 years), as were current pharmacological treatments (lipid-lowering agents, antihypertensive drugs, oral hypoglycemic agents) were also registered. Hypertension was recorded as present if documented in their medical records; it was noted that some patients were taking anti‐hypertensive medication for nonhypertensive indications. Diabetes mellitus was recorded as present if documented in the patients’ medical records.
The five components of the MetS were searched in all patients. Subjects having central obesity (waist circumference ≥ 102 cm for men and ≥ 88 cm for women) plus any two or more of the following criteria [ (1) triglyceride levels >1.7 mmol/L or current use of fibrates; (2) high-density lipoprotein cholesterol (HDL-C) level <1.0 mmol/L in men and <1.3 mmol/L in women, or receiving treatment for this lipid abnormality; (3) arterial pressure ≥ 130/85mmHg or pharmacologically treated; (4) fasting glucose ≥ 5.6 mmol/l or on treatment of elevated glucose] were labeled as MetS [8].
Methods
National Institute of Health (NIH) defined body mass index (BMI) as weight in kilograms divided by the square of height in meters. The obesity was considered as BMI ≥ 30kg/m2, overweight as 25kg/m2≤BMI≤29.9kg/m2 and normal weight - BMI < 25kg/m2 [9].
The laboratory evaluation included measurement of the fasting blood glucose, fasting serum triglycerides, total cholesterol, HDL-colesterol levels, alanine aminotransferase (ALAT) and aspartate aminotransferase (ASAT). For each patient, cardiovascular risk was estimated using the Framingham equation [4,10], Systematic COronary Risk Evaluation (SCORE) risk chat [6] and Atherosclerotic Cardiovascular Disease Risk Algorithm from the American College of Cardiology (ACC) and the American Heart Association (AHA) [5].
Ultrasonography and the Hamaguci Scoring System
Trained hepatologists (P.A.) performed abdominal ultrasonography with a 3.5 MHz transducer and a high-resolution B-mode scanner (General Electric, Logiq P6, GE Co., Ltd., Yorba Linda, USA). At ultrasounds, four parameters were tested: (1) diffuse hyperechoic echotexture (“bright liver”); (2) increased liver echotexture compared with the kidneys; (3) vascular blurring; (4) deep attenuation [11].
Inclusion criteria
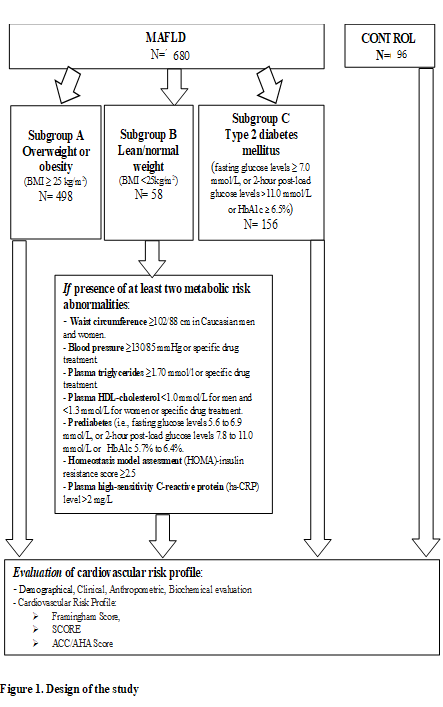
Experimental group - hepatic steatosis (detected by imaging techniques, ultrasound investigation using Hamaguci score more than 2) (N = 680). Subgroup A - overweight or obesity (defined as BMI ≥ 25 kg/m2) (N = 498). Subgroup B - lean/normal weight (defined as BMI < 25kg/m2). Presence of at least two metabolic risk abnormalities: waist circumference ≥ 102/88 cm (men/women); blood pressure ≥130/85 mmHg or specific drug treatment; plasma triglycerides ≥ 1.70 mmol/l or specific drug treatment; plasma HDL-cholesterol < 1.0 mmol/L for men and < 1.3 mmol/L for women or specific drug treatment; prediabetes (i.e., fasting glucose levels 5.6 to 6.9 mmol/L, or 2 - hour post-load glucose levels 7.8 to 11.0 mmol/L or HbA1c 5.7% to 6.4%; homeostasis model assessment (HOMA) - insulin resistance score ≥ 2.5; plasma high-sensitivity C-reactive protein (hs-CRP) level > 2 mg/L (N = 58). Subgroup C - Type 2 diabetes mellitus (fasting glucose levels ≥ 7.0 mmol/L, or 2-hour post-load glucose levels > 11.0 mmol/L or HbA1c ≥ 6.5%)) (N = 156). The control subjects had no evidence of fatty liver at ultrasounds. They were matched with FLD cases for age and sex (N = 96).
Exclusion criteria
(1) Metabolic genetic disorders of the liver (Wilson disease, hemochromatosis, deficiency of alfa1- antitripsine); (2) intestinal bypass surgery, glutenic entheropathy; (3) ingestion of drugs known to produce hepatic steatosis including methotrexate, tamoxifen, amiodarone, nucleoside analogues; (4) a history of another known liver disease; (5) lack of informed consent of the patient or his request to leave the study; (6) the presence of chronic active or decompensated organic disease; (7) neoplastic disorders.
Study design
Experimental group included patients with metabolic associated fatty liver disease (N = 680) and control group – patients without metabolic associated fatty liver disease (N = 96). Experimental group was divided in tree subgroups: Subgroup A – MAFLD - Overweight or obesity N = 498; Subgroup B – MAFLD - Lean/normal weight N = 58 and Subgroup C – MAFLD and Type 2 Diabetes Mellitus N = 156. In all of these subgroups cardiovascular risk profile was measured and compared (Figure 1).
The Ethics of Resource Committee of State University of Medicine and Pharmacy “Nicolae Testemițanu” approved the study (Approvement 33, Nb 44 from 12.05 2016). We obtained informed consent from all subjects.
Statistical analysis
The difference between groups with or without MAFLD was compared using an unpaired t test or nonparametric analysis (Mann-Whitney U test or Kruskal-Wallis test). One-Way ANOVA ("analysis of variance") compares the means of two or more independent groups in order to determine whether there is statistical evidence that the associated population means are significantly different. Linear regression analysis and Spearman rank correlation were used to examine the relationship between variables. A p value < 0.05 was considered significant. Data in text and tables are reported as mean ± SD. Variables used in the univariate comparison between groups were: age, central obesity, hypertriglyceridemia, low HDL-C, hypertension and high glucose. Correlations of all three scores estimates derived using dichotomized CVD risk scores (risk < 20% and ≥ 20%) were assessed using Spearman rank test.
Results
Baseline characteristics
Baseline characteristics of the study population are shown in Table 1. The mean age of the study subjects was 48.68 ± 10.85years and 439 (56.6%) were males. The predictable CV risk factors in the study subjects were hypertension (61.2%), diabetes (20.1%) and current smokers (14%). Around 51.2% had a family history of premature CVD. The mean BMI was 31.5 ± 5.3 kg/m2. Average LDL was 3.72 ± 0.54 mmol/L and HDL – 1.21 ± 0.34 mmol/L. A low HDL and high triglyceride were extremely prevalent.
10-year CV risk according to the different risk scores
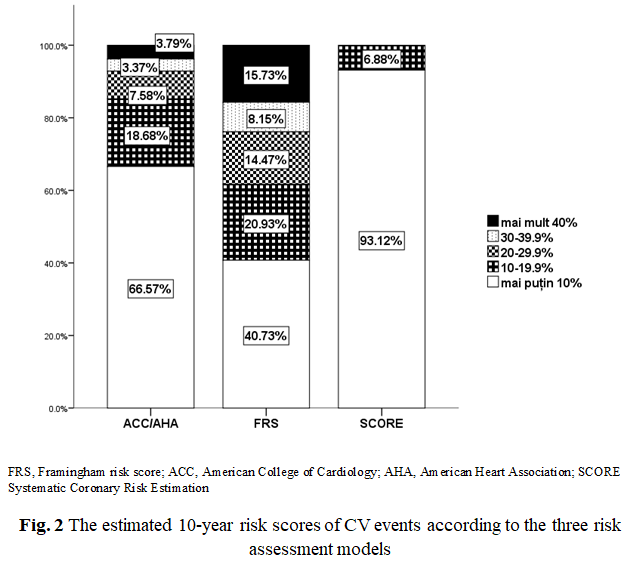
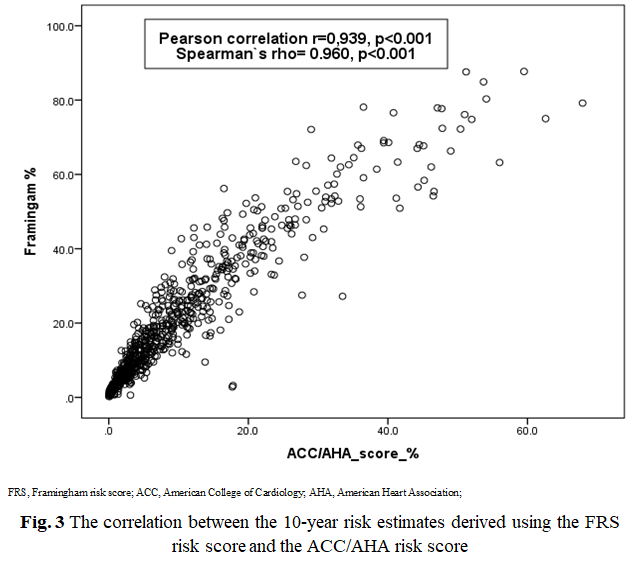
Experimental group. The 10-year CVD risk assessment was calculated in all patients using RiskFRS, RiskACC/AHA and Risk SCORE (Table 2, Figure 2). RiskSCORE (7% - with ≥ 10% risk) and Risk ACC/AHA (15% - with ≥ 20% risk) had identified the low proportion of patients with high risk, however, RiskFRS identified the highest proportion of the patients as being ‘at high-risk’ (38% with ≥ 20% risk). Statistically significant correlations were found between the scoring systems RiskFRS and RiskACC/AHA (Pearson's r = 0.939, p = 0.0001, Spearman`s rho=0.960, p <0.001) as shown in Figure 3 respectively.
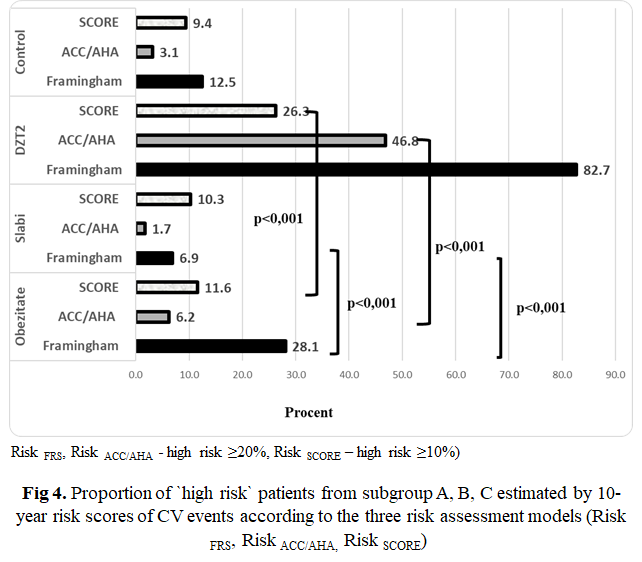
10-year CV risk according to the Subgroup A, B, C
Baseline characteristics of subgroup A, B, C are shown in Table 3. The mean age of the subgroup B (lean subject) was 43.83 ± 12.35 years and represented statistical difference with subgroup A and C (47.7 ± 10.9 vs 54.38 ± 7.5 (p<0.05), respective); 39.7% (23/58) were males, which differ significantly statistic from subgroup A and C – 63.1% vs 51.9% (p < 0.05). The predictable, CV risk factors in the subgroup A and C were hypertension (40% vs 89.1%) with statistical difference with subgroup B – 29.3% (p < 0.05) and prevalence of current smokers was higher in subgroup B – 24.1% (p < 0.05). Around 62% had a family history of premature CVD in subgroup C, with statistical difference with subgroup A – 49.6% (p < 0.05). The mean body-mass index was the highest in subgroup C – 33.2 ± 5.2 kg/m2, with significant statistical difference with subgroup A and B – 31.9 ± 4.6 kg/m2 vs 22.9 ± 2.1 kg/m2, respectively (p < 0.05).
The 10-year CVD risk assessment was calculated in all subgroups using Risk FRS, Risk ACC/AHA and Risk SCORE (Table 4, Figure 4). Risk FRS identified the highest proportion of the patients as being ‘at high-risk’ from group C – DMT2- 82.7% with ≥ 20% risk, with statistically significant difference between group A and B – 28.1 % vs 6.8%, p - < 0.001. The same tendency was observed for Risk SCORE and Risk ACC/AHA. Risk SCORE (subgroup. A – 11.6%; subgroup B – 10.3%, subgroup C – 26.3% with ≥ 10% risk) and Risk ACC/AHA (subgroup A – 6.2%; subgroup B – 1.7%, subgroup C – 46.8% with ≥ 20% risk) have identified the low proportion of patients with high risk.
Discussion
Assessment of the risk of future CV events is a primary concept in preventive cardiology. Reduction of cardiovascular disease burden is commonly accomplished using preventive strategies (like lifestyle and dietary advice or preemptive drug treatment) in individuals with marked elevations in risk factors [12]. Existing prevention strategies tend to focus on patients at relatively short-term (10-year) risks and upon specific thresholds for pharmacological therapies. This approach is intelligent and has been successful in guiding treatment to those at higher risks that remain to gain the greatest advantage [13]. Identification of high-risk individuals is often achieved using CVD risk prediction models of which over 360 different variants have been published [14]. However, different prediction models may predict different (sets of) CVD outcomes which may lead to variation in selection of high-risk individuals. Consequently, it is unclear to what extent the predicted CVD risks obtained from different prediction models are comparable and can be interpreted similarly in clinical practice [15-18].
The interpretation of the associated consequences of predicted CVD risks is directly affected by the different composite endpoints. The Risk FRS which was created in 1998 anticipated only coronary heart disease risk but another general risk forecast tool was developed in 2008 to predict the general CV risk, associated with a large combination of CVD outcomes including myocardial infarction, coronary death, coronary insufficiency, angina, ischemic stroke, hemorrhagic stroke, transient ischemic attack, peripheral artery disease and heart failure. In contrast, the other risk engines/ tools estimate risk mainly for myocardial infarction and stroke only [3]. The "2013 ACC/AHA guideline on the assessment of CV risk" provides clear recommendations for estimating CVD ‘at high risk’ [5]. The essential goal for developing Risk ACC/AHA has demonstrated the cholesterol management among adults [19]. The SCORE charts have been developed to estimate risk in both high- and low-risk European populations. Since 2003, the European Guidelines on CVD prevention in clinical practice recommend use of the SCORE system, because it is based on large, representative European cohort datasets. The SCORE system estimates the 10-year risk of a first fatal atherosclerotic event.
The results of the present study show the comparison of different CVD risk assessment models in patients with hepatic steatosis. Risk FRS model could stratify effectively patients into high CVD risk in comparison with Risk ACC/AHA and Risk score thatrecognize lower number of patients. In addition, the expected health loss due to events predicted by SCORE is expected to be higher than the health burden or health loss due to events predicted by FRS due to how all included events in SCORE are fatal, but can fatal or non-fatal in FRS. Even for a single prediction model, the impact of experiencing a predicted composite event is likely to depend on age, since a) the proportion of fatal events increases with age, and b) the actual health loss due to CVD events decreases with age (i.e., with decreasing life expectancy). Models are applied that have a broad rather than narrow composite endpoint, i.e., models covering a large range of CVD event types. For example, SCORE may be less useful in this context than FRS, as the latter cover more manifestations of the underlying cardiovascular disease process.
The large variation in CVD risk estimates combined with different recommended risk thresholds for each prediction model, may lead to different definitions of high-risk individuals. For example, the Pooled Cohort Equation stratifies individuals with a > 7.5% 10-year CVD risk as high-risk whereas the recommended threshold for the Framingham risk equation is 10% [5,20]. Different definitions of high-risk individuals may, in turn, lead to different treatment recommendations. Furthermore, the expected health benefits of treatment may also be different since the impact on quality of life differs per CVD event type and severity. For example, the expected health loss due to a stroke is expected to be higher than the health loss due to a myocardial infarction [21].
Conclusion
The present study shows that Framingham model appeared to be the most useful CVD assessment model for patient with hepatic steatosis, because this equation is likely to identify a greater number of patients at “high risk” as compared to ACC/AHA and SCORE models.
Competing interests
None declared
Authors’ contributions
AP conceived the concept and design of the work, performing of the experimental procedures, collected, analyzed and interpreted data, manuscript preparation and work publication. VI - participated in study design, collection of data and helped drafting the manuscript, approved the final version of the manuscript ready for publication.IT – performing the collection and analysis of data, helped drafting the manuscript. SM - has made a substantial personal contribution in designing, developing research protocol, reviewed critically the manuscript bringing a significant intellectual contribution, approved the final version of the manuscript ready for publication; approved the final version of the manuscript ready for publication. Final manuscript was read and approved by all authors.
Authors’ ORCID IDs
Angela Peltec - https://orcid.org/0000-0002-2616-5634
Victoria Ivanov - https://orcid.org/0000-0001-9258-2092
Sergiu Matcovschii - https://orcid.org/0000-0003-1623-930X
Tabel 1. Caracteristicele de bază a populației din studiu (n = 776). Table 1. Baseline characteristics of the study population (n = 776). | ||||
Parametrii/ Parameters | Populația studiată/ Study population N = 776 | Grupul experimental/ Experimental group N = 680 | Grupul de control/ Control group N = 96 | p/ p |
Vârsta (ani), media ± DS/ Age (year), mean ± SD | 48,68 ± 10,85 | 46,84 ± 10,85 | 46,84 ± 10,85 | 0,157 |
Gen masculin (%)/ Male gender (%) | 439 (56,6*) | 418 (58,7) | 36 (56,25) | 0,709 |
Hipertensiunea (%)/ Hypertension (%) | 475 (61,2) | 455 (63,9) | 20(31,2) | < 0,05 |
Diabet zaharat (%)/ DMT2 (%) | 156 (20,1) | 156 (21,9) | 0 | < 0,05 |
Fumători curenți (%)/ Current smokers (%) | 109 (14,0) | 99 (13,9) | 10 (15,6) | 0,704 |
Alcool (%)/ Alcohol (%) | 196 (24,3) | 184 (25,8) | 12 (18,7) | 0,029 |
Istoric familial de BCV(%)/ Family history CVD (%) | 397 (51,2) | 362 (50,8) | 35 (54,7) | 0,558 |
Istoric familiar de DZT2 (%)/ Family history DMT2 (%) | 189 (24,4) | 174 (24,4) | 15 (23,4) | 0,858 |
IMC (kg/m2), media ±DS/ BMI (kg/m2), mean ±SD | 31,04 ± 5,43 | 31,58 ± 5,20 | 26,98 ± 4,95 | < 0,05 |
Obezitatea abdominală (%)/ Abdominal obesity (%) | 677 (87,2) | 646 (90,7) | 42 (65,6) | < 0,01 |
Colesterol total (mmol/L)/ Total cholesterol (mmol/L) | 5,55 ± 1,35 | 5,59 ± 1,36 | 5,32 ± 1,27 | 0,99 |
HDL colesterol (mmol/L)/ HDL cholesterol (mmol/L) | 1,21 ± 0,344 | 1,39 ± 0,46 | 1,17 ± 0,32 | 0,003 |
LDL colesterol (mmol/L)/ LDL cholesterol (mmol/L) | 3,96 ± 1,29 | 4,00 ± 1,29 | 3,60 ± 1,25 | 0,804 |
Trigliceride (mmol/L)/ Triglyceride (mmol/L) | 1,98 ± 1,38 | 2,06 ± 1,26 | 1,54 ± 0,66 | < 0,01 |
Sindrom metabolic(%)/ Metabolic Syndrome (%) | 514 (66,2) | 503 (70,6) | 23 (35,4) | < 0,01 |
Hiperglicemia(%)/ Hyperglycemia (%) | 341 (43,9) | 334 (46,9) | 15 (22,9) | < 0,01 |
Hipertrigliceridemia(%)/ Hypertriglyceridemia (%) | 386 (49,7) | 375 (52,6) | 19 (29,2) | < 0,01 |
HipoLDL(%)/ Hypo LDL (%) | 463 (59,7) | 445 (62,5) | 25 (39,6) | < 0,01 |
Nota: *Numerele în paranteze indică % din populația totală. Abrevierile: DS – deviația standard; IMC - Indicele de Masa Corporală; BCV – boli cardiovasculare; DZT2 – diabet zaharat tip 2. Note: *Numbers in parenthesis indicate % of total population. Abbreviations: SD – standard deviation, BMI - Body mass index, CVD – cardiovascular disease, DMT2 – diabetes mellitus type 2. | ||||
Tabelul 2. Riscul estimat de evenimente CV în 10 ani, în acord cu diferite modele de evaluare al populației studiate. Table 2. Estimated 10-year risk of CV events according to different risk assessment models in the study population. | ||||
Categorii de risc CV de 10 ani/ 10yr CV Risk category | Risc ACC/AHA/ Risk ACC/AHA | Risc SCORE/ Risk SCORE | Risc FRS/ Risk FRS | p/ p |
<10% | 472 (66%) | 663 (93%) | 290 (41%) | < 0,001 |
10 - 19,9% | 133 (19%) | 49 (7%) | 149 (21%) | |
20 - 29,9% | 54 (8%) | 0 | 103 (14%) | |
30 - 39,3% | 24 (3%) | 0 | 58 (8%) | |
> 40% | 27 (4%) | 0 | 112 (16%) | |
Nota: p <0,01 pentru toate modele de risc comparate. Abrevierile: CV - cardiovascular; FRS - Framingham risc scor; ACC - American College of Cardiology; AHA - American Heart Association; SCORE - Systematic Coronary Risk Estimation Note: p <0,01 for all comparisons of risk models. Abbreviations: CV - cardiovascular; FRS - Framingham risk score; ACC - American College of Cardiology; AHA - American Heart Association; SCORE - Systematic Coronary Risk Estimation | ||||
Tabelul 3. Caracteristicele de bază al subgrupei A, B, C. Table 3 Baseline characteristic of subgroup A, B, C. | ||||
Parametrii Parameters | Supraponderali sau obezi (IMC ≥ 25 kg/m2)/ Overweight or obesity (defined as BMI ≥ 25 kg/m2) N = 498 | Slabi/masa ponderală normală (IMC <25kg/m2)/ Lean/normal weight (defined as BMI < 25kg/m2) N = 58 | DZT2/ DMT2 N = 156 | p/ p |
Vârsta (ani), media ± DS/ Age (year), mean ± SD | 47,7 ± 10,9 | 43,83 ± 12,3* | 54,38 ± 7,5 | < 0,05 |
Genul masculin(%)/ Male gender (%) | 314 (63,1) | 23 (39,7)* | 81(51,9)* | < 0,05 |
Hipertensiunea (%)/ Hypertension (%) | 299 (40) | 17 (29,3) | 139 (89,1)* | < 0,001 |
Fumători curenți (%)/ Current smokers (%) | 67 (13,5) | 14 (24,1)* | 18 (11,5) | < 0,05 |
Alcool (%)/ Alcohol (%) | 131 (26,3) | 19 (32,7) | 34 (21,8) | 0,2990 |
Istoric familial PCV (%)/ Family history CVD (%) | 247 (49,6) | 18 (31)* | 97 (62,2)* | < 0,05 |
Istoric familial DZT2 (%)/ Family history DMT2 (%) | 102 (20,5) | 5 (8,6)* | 67 (42,9)* | < 0,05 |
IMC (kg/m2), media ± DS/ BMI (kg/m2), mean ±SD | 31,9 ± 4,6 | 22,9 ± 2,1* | 33,2 ± 5,2* | < 0,05 |
Nota: *Numerele în paranteze indică % din populația totală. Abrevierile: IMC - Indicele Masei Corporale; PCV – patologia cardiovasculară; DZT2 – diabet zaharat tip 2. Note: *Numbers in parameter indicate % of total population. Abbreviations: BMI - Body mass index; CVD – cardiovascular disease; DMT2 – diabetes mellitus type 2. | ||||
Tabelul 4. Proporția pacienților cu risc crescut de evenimente CV la 10 ani în acord cu modelul Risc FRS, Risc SCORE și Risc ACC/AHA în subgrupe A, B, C. (Risc FRS, Risc ACC/AHA - scorul de risc înalt ≥20%, Risc SCORE – scorul de risc înalt ≥10%). Table 4. Proportion of high-risk patients estimated by10-year risk of CV events according Risk FRS, Risk SCORE and Risk ACC/AHA in subgroup A, B, C. (Risk FRS, Risk ACC/AHA - high risk score ≥20%, Risk SCORE - high risk score ≥10%). | ||||
Modelul de evaluare a riscului/ Risk assessment model | Obezitate / Obesity N=498 | Slabi/ Lean N=58 | DZT2 / DMT2 N=156 | p / p |
Risc FRS / Risk FRS | 140 (28,1%) | 4 (6,9%)* | 129 (82,7%)* | < 0,001 |
Risc SCORE / Risk SCORE | 58 (11,6%) | 6 (10,3%) | 41 (26,3%)* | < 0,001 |
Risc ACC/AHA / Risk ACC/AHA | 31 (6,2%) | 1 (1,7%) | 73 (46,8%)* | < 0,001 |
Nota: *valori cu p <0,001; valoarea p <0,01 pentru toate modele de risc comparate. Abrevierile: CV - cardiovascular; FRS - Framingham risc scor; ACC - American College of Cardiology; AHA - American Heart Association; SCORE - Systematic Coronary Risk Estimation. Note: *value with p <0,001; p value <0,01 for all comparisons of risk models. Abbreviations: CV - cardiovascular; FRS - Framingham risk score; ACC - American College of Cardiology; AHA - American Heart Association; SCORE - Systematic Coronary Risk Estimation. | ||||
Referințe
Wong WK., Chan WK. Nonalcoholic fatty liver disease: a global perspective. Clin her, 2021; 43: 473-499.
Przybyszewski EM., Targher G., Roden M. et al. Nonalcoholic Fatty Liver Disease and Cardiovascular Disease. Clin Liver Dis, 2021;17(1): 19-22.
Garg N., Muduli SK., Kapoor A., Tewari S., Kumar S., Khanna R., Goel PK. Comparison of different cardiovascular risk score calculators for cardiovascular risk prediction and guideline recommended statin uses. Indian Heart J, 2017; 69(4): 458-63.
D'Agostino RB., Pencina MJ., Massaro JM., Coady S. Cardiovascular Disease Risk Assessment: Insights from Framingham. Glob Heart, 2013; 8(1): 11-23.
Goff DC., Lloyd-Jones DM., Bennett G., Coady S., D’agostino RB., Gibbons R. et al. 2013 ACC/AHA guideline on the assessment of cardiovascular risk: a report of the American College of Cardiology/American Heart Association Task Force on Practice Guidelines. J Am Coll Cardiol, 2014; 63(25 Part B): 2935-59.
Piepoli MF., Hoes AW., Agewall S., Albus C., Brotons C., Catapano AL. et al. 2016 European Guidelines on cardiovascular disease prevention in clinical practice: The Sixth Joint Task Force of the European Society of Cardiology and Other Societies on Cardiovascular Disease Prevention in Clinical Practice Eur Heart J, 2016; 37(29): 2315-2381.
Kondo T., Osugi S., Shimokata K. et al. Smoking and smoking cessation in relation to all‐cause mortality and cardiovascular events in 25,464 healthy male Japanese workers. Circ J, 2011; 75: 2885‐ 2892.
The IDF consensus worldwide definition of the metabolic syndrome. 2005; available at: http://www.idf.org/webdata/docs/MetSyndrome_ FINAL.pdf.
Wharton S., Lau D., Vallis M. et al. Obesity in adults: a clinical practice guideline. CMAJ, 2020; 192: E875-91. doi: 10.1503/cmaj.191707
Anderson KM., Wilson PW., Odell PM., Kannel WB. An updated coronary risk profile: a statement for health professionals. Circulation, 1991; 83: 356-362.
Hamaguchi M., Takao K., Yoshito I., Yuichi H., Kota F., Tomoaki N. et al. The Severity of Ultrasonographic Findings in Nonalcoholic Fatty Liver Disease Reflects the Metabolic Syndrome and Visceral Fat Accumulation. The American Journal of Gastroenterology, 2007; 102: 2708-2715. DOI:10.1111/j.1572-0241.2007. 01526.x.
Nayor M., Vasan R.S. Recent Update to the US Cholesterol Treatment Guidelines: A Comparison With International Guidelines. Circulation, 2016; 133(18): 1795–806. https://doi.org/10.1161/ CIRCULATIONAHA.116.021407 PMID: 27143546.
Board JB. Joint British Societies’ consensus recommendations for the prevention of cardiovascular disease (JBS3). Heart, 2014 Apr 1; 100(Suppl 2): ii1-67.
Damen JA., Hooft L., Schuit E. et al. Prediction models for cardiovascular disease risk in the general population: systematic review. BMJ, 2016; 353: i2416. https://doi.org/10.1136/bmj.i2416 PMID: 27184143.
Doustv JA., Bonner C., Bell KJL. Future directions in cardiovascular disease risk prediction. Aust J Gen Pract, 2020; 49 (8): 488-494.
Kent DM., Shah ND. Risk models and patient-centered evidence: should physicians expect one right answer? JAMA, 2012; 307(15): 1585–6. https://doi.org/10.1001/jama.2012.469 PMID: 22511683.
Rossello X., Dorresteijn JAN., Janssen A. et al. Risk prediction tools in cardiovascular disease prevention: A report from the ESC Prevention of CVD Programme led by the European Association of Preventive Cardiology (EAPC) in collaboration with the Acute Cardiovascular Care Association (ACCA) and the Association of Cardiovascular Nursing and Allied Professions (ACNAP). Eur J Prev Cardiol, 2019; 26(14): 1534–1544.
Li Y., Sperrin M., Belmonte M. et al. Do population-level risk prediction models that use routinely collected health data reliably predict individual risks? Sci Rep, 2019; 9: 11222. https://doi.org/10.1038/s41598-019-47712-5
Stone NJ., Robinson JG., Lichtenstein AH., Bairey Merz CN., Blum CB., Eckel RH. et al. 2013 ACC/AHA guideline on the treatment of blood cholesterol to reduce atherosclerotic cardiovascular risk in adults: a report of the American College of Cardiology/American Heart Association Task Force on Practice Guidelines. J Ame Coll Cardiol, 2014; 63(25 Pt B): 2889-934.
Lundberg GP., Mehta LS., Sanghani RM. et al. Heart Centers for Women: Historical Perspective on Formation and Future Strategies to Reduce Cardiovascular Disease. Circulation, 2018; 138(11): 1155-1165. DOI: 10.1161/circulationaha.118.035351.
Brett T., Radford J., Qureshi N, Pang J, Watts GFW. Evolving worldwide approaches to lipid management and implications for Australian general practice. Aust J Gen Pract, 2021; 50 (5): 297-304.