

Introduction
Laryngeal cancer represents about 3% of all malignancies and is associated with significant diagnostic challenges related to initial diagnosis, staging, and guiding treatment strategies [1-3].
In the Republic of Moldova, the incidence of laryngeal cancer has increased during the last few years, with the official records being as follows: 2.4% (109 cases) in 2000, 2.5% (138 cases) in 2010, 2.8% (143 cases) in 2016, and 2.9% (157 cases) in 2019. Furthermore, late referral cases predominate, with around 80–85% of patients being diagnosed in advanced stages of the disease (stages III-IV) [3, 4]. The 5-year survival rates in patients treated in the Republic of Moldova in this period varied from 83–92% in early disease stages (stages I–II) to about 35% in patients diagnosed with advanced disease (stages III-IV) [3, 4]. This underscores the importance of early diagnosis and optimal imaging investigations in these patients [3-6].
Radiographic imaging is associated with the lowest radiation dose and is commonly used as a first-line modality, being readily available in outpatient settings and primary care institutions. Laryngoscopy provides additional details and allows tumor biopsy; however, it is less accurate in determining tumor extension, especially since over 80% of laryngeal cancers are associated with infiltrative growth [3, 7].
Cross-sectional imaging with computed tomography (CT) and magnetic resonance imaging (MRI) allows excellent depiction of the intricate anatomy of the larynx and the characteristic patterns of submucosal tumor extension [8]. Additionally, certain imaging-based parameters like tumor volume and cartilaginous abnormalities have been used to predict the success of primary radiotherapy or surgery in these patients [8]. Due to the short acquisition time and the possibility to perform functional maneuvers, CT is commonly considered the tool of choice [9], but is also associated with a higher radiation dose. MRI allows better soft tissue differentiation but is more susceptible to movement artifacts and is complicated by disease-specific symptoms [9]. Higher costs, imaging time, and availability represent additional issues.
Digital tomosynthesis (DT), a new tomographic technique that is associated with a much lower radiation dose, may offer an alternative to CT. It uses a conventional radiograph tube, a flat-panel detector, a computer-controlled tube mover, and reconstruction algorithms to produce section images [10]. Digital tomosynthesis is already widely used in the diagnosis of breast cancer and has shown promising results in evaluating patients with other pathologies [10-15].
At the time of conducting the study, there were no data in the literature regarding the use of digital tomosynthesis in the imaging diagnosis of laryngeal pathology. The purpose of this study was to evaluate the usefulness of digital tomosynthesis in the diagnosis of laryngeal cancer and to compare the imaging results with those obtained by digital radiography and computed tomography.
Material and methods
The study was carried out between 2015 and 2019 at the Institute of Oncology in the Republic of Moldova and included 253 consecutive patients with laryngeal cancer who provided written informed consent. All patients underwent histological investigations for confirmation of their diagnosis. The staging of tumors was done according to the existing TNM classification developed by the American Joint Committee on Cancer (AJCC) and the Union for International Cancer Control (UICC).
A total of 250 (98.81%) patients were male, and only 3 (1.19%) were female. The age limits varied between 48 and 76 years, with the mean value being 62.35±2.70 years. When divided into age groups, 15 (5.93%) patients were between 41 and 50 years old, 77 (30.43%) patients were between 51 and 60 years old, 132 (52.17%) patients were between 61 and 70 years old, and 29 (11.46%) patients were between 71 and 80 years old. According to the TNM classification, at the time of diagnosis, 15 (5.93%) patients had stage I disease, 68 (26.88%) patients had stage II disease, 136 (53.75%) patients had stage III disease, and 34 (13.44%) patients had stage IV disease.
All patients underwent digital radiography and digital tomosynthesis investigations. In 41 patients who provided separate informed consent for this purpose, computed tomography was performed. The results of all imaging investigations were subsequently compared. A correlation was also made with intraoperative and histopathology findings, as well as with the final diagnosis indicated in the patient’s chart on discharge.
The standard statistics kits were used for data analysis through Microsoft Excel, MedCalc (version 20.106), and IBM SPSS Statistics (version 26.0). The results obtained by the 3 imaging modalities were evaluated using comparison tests, linear regression, and agreement analysis.
The research was approved by the Research Ethics Committee of the Nicolae Testemitanu State University of Medicine and Pharmacy (No. 22 of November 7, 2016). All patients provided informed written consent.
Results
The imaging findings revealed by digital radiography, computed tomography, and digital tomosynthesis in the group of patients who underwent all 3 investigations (n = 41) are presented in Table 1.
When compared to computed tomography, which is considered the gold standard, digital tomosynthesis proved to have a much higher performance compared to digital radiography. For example, the tumor mass was detected in 100% of patients by computed tomography, in 95.12% of patients by tomosynthesis, and in only 63.41% of patients by digital radiography. Similarly, digital tomosynthesis was superior to digital radiography in evaluating local tumor spread and invasion of adjacent anatomical structures (Table 1). Thus, unilateral ligament thickening was noted in 85.37% of cases by computed tomography, in 78.05% of cases by tomosynthesis, and in only 48.48% of patients by digital radiography. The findings were confirmed by the results of statistical analysis that included calculation of concordance correlation coefficients, linear regression, and agreement analysis of the obtained data by all 3 imaging modalities.
Table 1. Radiological findings in patients with laryngeal cancer revealed by digital radiography, computed tomography and digital tomosynthesis. | |||
Radiological signs | Digital Radiography n (%) | Computed Tomography n (%) | Digital Tomosynthesis n (%) |
Tumor mass detection | 26 (63.41%) | 41 (100%) | 39 (95.12%) |
Unilateral ligament thickening | 20 (48.78%) | 35 (85.37%) | 32 (78.05%) |
Bilateral ligament thickening | 3 (7.32%) | 6 (14.63%) | 5 (12.20%) |
Asymmetrical arytenoid thickening | 1 (2.44%) | 6 (14.63%) | 3 (7.32%) |
Morgagni's sinus flattening | 17 (41.46%) | 33 (80.49%) | 30 (73.17%) |
Incomplete closure of laryngeal ligaments | 13 (31.71%) | 35 (85.37%) | 32 (78.05%) |
Subligamentous space flattening | 14 (34.15%) | 25 (60.98%) | 21 (51.22%) |
Enlarged prechondral space | 8 (19.51%) | 9 (21.95%) | 9 (21.95%) |
Cartilage invasion | 8 (19.51%) | 12 (29.27%) | 13 (31.71%) |
Unilateral piriform sinus invasion | 13 (31.71%) | 27 (65.85%) | 22 (53.65%) |
Bilateral piriform sinus invasion | 2 (4.88%) | 6 (14.63%) | 5 (12.20%) |
The concordance correlation coefficients for various radiological findings revealed by digital tomosynthesis and by digital radiography compared to the standard method (computed tomography) are provided in Table 2 and Table 3, respectively. As described in the literature, the concordance correlation coefficient reflects the degree of agreement between two methods or assessments and can take values between 0 and 1, being a non-directional coefficient. Values close to 0 indicate no agreement, while values close to 1 show perfect agreement [16]. Furthermore, the concordance correlation coefficient (ρc) contains a measurement of precision (ρ) and accuracy (Cb), i.e., ρc = ρCb, where ρ is the Pearson correlation coefficient, which measures how far each observation deviates from the best-fit line and is a measure of precision, and Cb is a bias correction factor that measures how far the best-fit line deviates from the 45° line through the origin and is a measure of accuracy [16]. The values of these coefficients obtained in our study are also provided in tables 2 and 3.
The statistical analysis of imaging parameters obtained by digital tomosynthesis and computed tomography (which is considered the gold standard) revealed a concordance coefficient between 0.63 and 1.0 for various parameters, with a mean value of 0.82±0.11 (Table 2). The Pearson correlation coefficient ranged from 0.68 to 1.0 for various parameters with a mean value of 0.83±0.10, while the Cb correction factor reflecting accuracy ranged from 0.93 to 1.0 for various parameters with an average value of 0.98±0.02 (Table 2). These data reflect a high concordance between the results obtained by digital tomosynthesis and computed tomography.
Table 2.Evaluation of radiological findings revealed by digital tomosynthesis in patients with laryngeal cancer as compared to the gold standard (computed tomography). | |||
Radiological signs | Concordance correlation coefficient | Pearson ρ (precision) | Bias correction factor Cb (accuracy) |
Tumor mass detection | 0.66 | 0.70 | 0.94 |
Unilateral ligament thickening | 0.85 | 0.86 | 0.99 |
Bilateral ligament thickening | 0.90 | 0.90 | 0.99 |
Asymmetrical arytenoid thickening | 0.63 | 0.68 | 0.93 |
Morgagni's sinus flattening | 0.80 | 0.81 | 0.98 |
Incomplete closure of laryngeal ligaments | 0.76 | 0.78 | 0.97 |
Subligamentous space flattening | 0.80 | 0.82 | 0.98 |
Enlarged prechondral space | 1.00 | 1.00 | 1.00 |
Cartilage invasion | 0.94 | 0.94 | 1.00 |
Unilateral piriform sinus invasion | 0.75 | 0.77 | 0.97 |
Bilateral piriform sinus invasion | 0.90 | 0.90 | 0.99 |
Mean±standard deviation | 0.82±0.11 | 0.83±0.10 | 0.98±0.02 |
Table 3.Evaluation of radiological findings revealed by digital radiography in patients with laryngeal cancer as compared to the gold standard (computed tomography). | |||
Radiological signs | Concordance correlation coefficient | Pearson ρ (precision) | Bias correction factor Cb (accuracy) |
Tumor mass detection | 0.08 | 0.21 | 0.40 |
Unilateral ligament thickening | 0.33 | 0.44 | 0.74 |
Bilateral ligament thickening | 0.63 | 0.68 | 0.93 |
Asymmetrical arytenoid thickening | 0.25 | 0.38 | 0.67 |
Morgagni's sinus flattening | 0.29 | 0.41 | 0.71 |
Incomplete closure of laryngeal ligaments | 0.15 | 0.28 | 0.52 |
Subligamentous space flattening | 0.50 | 0.58 | 0.87 |
Enlarged prechondral space | 0.93 | 0.93 | 0.99 |
Cartilage invasion | 0.74 | 0.77 | 0.97 |
Unilateral piriform sinus invasion | 0.39 | 0.49 | 0.79 |
Bilateral piriform sinus invasion | 0.46 | 0.55 | 0.84 |
Mean±standard deviation | 0.43±0.25 | 0.52±0.21 | 0.77±0.19 |
On the contrary, statistical analysis of the imaging parameters obtained by digital radiography versus computed tomography revealed a concordance coefficient between 0.08 and 0.93 for various parameters, with a mean value of 0.43±0.25 (Table 3). The Pearson correlation coefficient varied between 0.21 and 0.93 for various parameters with an average value of 0.52±0.21, while the Cb correction factor reflecting accuracy varied between 0.40 and 0.99 for various parameters with a mean value of 0.77±0.19 (Table 3). Overall, the statistical analysis reflects a much weaker concordance of the results obtained by digital radiography compared to those obtained by digital tomosynthesis (Tables 2-3).
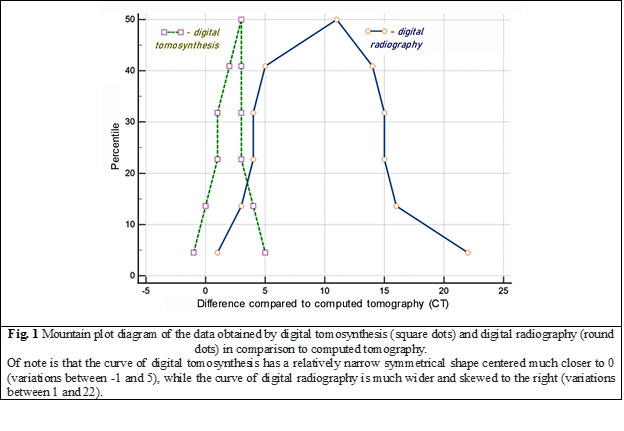
The data obtained by the three imaging modalities were also compared using the mountain plot analysis for agreement evaluation (Fig. 1). A mountain plot (or "folded empirical cumulative distribution plot") shows the distribution of the differences between two methods and is commonly used to evaluate the difference between a new method and a reference method [17]. If two assays are unbiased with respect to each other, the mountain will be centered over zero [17]. Long tails in the plot reflect large differences between the methods [17]. The graphs shown in Figure 1 display the differences between the data obtained by digital tomosynthesis (square dots) and digital radiography (round dots) in relation to a gold standard (computed tomography). It is worth noting that the curve representing the data obtained by digital tomosynthesis has a relatively narrow, symmetrical shape that is centered much closer to 0 and has small deviations in its values between -1 and 5. On the contrary, the curve representing the data obtained by digital radiography is much wider, prominently skewed from 0 to the right, with significant variations in its values between 1 and 22. The diagrams demonstrate a very high degree of agreement between the data obtained by digital tomosynthesis and computed tomography (the standard method) and a much lower degree of agreement with the data obtained by digital radiography.
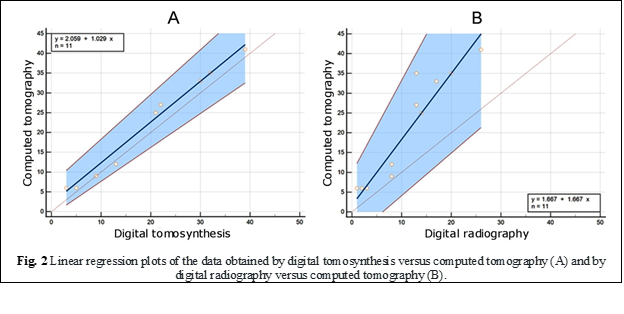
The results were also confirmed by the linear regression diagrams of the values obtained by digital tomosynthesis versus computerized tomography (Fig. 2A) and those obtained by digital radiography versus computerized tomography (Fig. 2B). As is well known, one of the most popular techniques for modeling the relationship between two pairs of numerical data, in this case obtained by different imaging modalities, is linear regression. In our analysis, the scatter plot of digital tomosynthesis versus computed tomography values (Fig. 1A) demonstrates a strong, positive relationship and much tighter clustering of data points compared to conventional radiography values (Fig. 1B), revealing also a stronger linear correlation of tomosynthesis data with a correlation coefficient r = 0.993 (p < 0.0001).
Discussions
Digital tomosynthesis has been recently introduced as an advanced clinical technique that removes overlying structures, enhances local tissue separation, and provides depth information about structures of interest by providing high-quality tomographic images [18]. One of its main advantages over standard computed tomography is the low radiation dose. For example, for imaging the chest region, previous studies have reported an effective dose for adults ranging between 0.12-0.21 mSv for thoracic tomosynthesis depending on selected parameters, patient constitution, and the region of interest investigated [19, 20]. As comparative values reported within the same studies, the average radiation dose for chest radiography was 0.10 mSv, and for computed tomography of the chest region – 6.8 mSv [19]. Low-dose protocols with an effective dose of 98.87 +/- 0.08 microSv have also been created [21].
Although a relatively new imaging method, digital tomosynthesis is already widely used in the evaluation and screening of breast pathology, and there are an increasing number of reports related to its usefulness in the evaluation of other systems and pathologies [10-15, 18, 19, 21]. Due to its low radiation dose, digital tomosynthesis has also been used in pediatric patients as well as for screening purposes [20, 22-25].
In our study, we showed the usefulness of tomosynthesis for the evaluation of patients with laryngeal cancer. The statistical evaluation revealed a concordance coefficient with computed tomography between 0.63 and 1.0, as well as high agreement and a strong linear correlation of the obtained data on the mountain plot and linear regression analysis. To underline the practical value of digital tomosynthesis in patient care, a clinical case report from this study is also presented below.
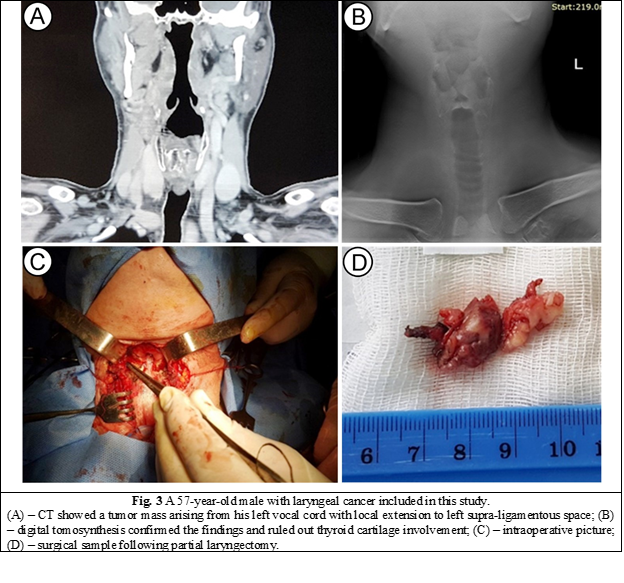
A 57-year-old male presented to a primary care institution with voice changes and discomfort in his throat upon swallowing for two months. A computed tomography scan was performed and showed an invasive tumor mass arising from his left vocal cord with local extension to the anterior and posterior commissures of the larynx, the left supra-ligamentous space, as well as concern for potential involvement of his thyroid cartilage that required further investigation. A digital tomosynthesis performed at our institution ruled out tumor extension to the thyroid cartilage, and the patient underwent partial instead of total laryngectomy (Fig. 3). Histopathology results of the surgical sample showed negative margins for tumor infiltration.
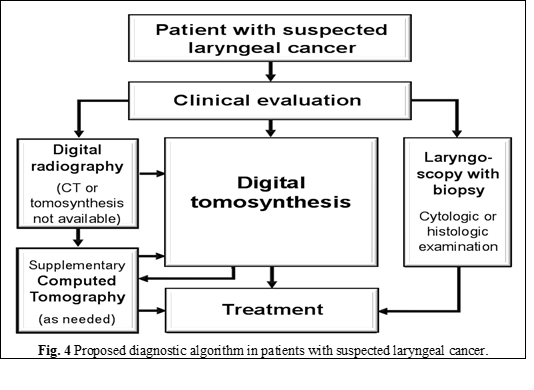
The results of this study, as well as the acquired experience at the Institute of Oncology, allowed us to introduce digital tomosynthesis into the imaging algorithm for patients with laryngeal cancer (Fig. 4) [4]. Nevertheless, new studies are required to confirm our findings and to define the place of digital tomosynthesis in the imaging algorithm of patients with laryngeal cancer, especially since, to our knowledge; currently there are no published articles on this topic. Considering the availability of low-dose protocols for digital tomosynthesis, the modality might also be suitable for laryngeal cancer screening in high-risk populations; however, this also requires new studies on digital tomosynthesis.
Conclusions
The study demonstrated the usefulness of digital tomosynthesis for the evaluation of patients with laryngeal cancer. When compared to computed tomography, which is considered the gold standard, digital tomosynthesis revealed a much higher performance compared to digital radiography.
The statistical analysis revealed a high degree of agreement and a strong linear correlation between the data obtained with digital tomosynthesis and computed tomography, as well as concordance correlation coefficients for different parameters ranging between 0.63 and 1.0. The results show that digital tomosynthesis can replace computed tomography in certain clinical situations, significantly lowering the cost and the radiation dose for patients with laryngeal cancer who frequently require repeated imaging investigations.
The results of this study allowed us to introduce digital tomosynthesis into the imaging algorithm for patients with laryngeal cancer. However, new studies are also required to confirm our findings and define the place of digital tomosynthesis in the imaging algorithm for patients with laryngeal cancer.
Given the availability of low-dose protocols for digital tomosynthesis, the modality may be useful for laryngeal cancer screening in high-risk populations; however, additional research is needed to assess its suitability for this purpose.
Competenig interests
None declared
Authors’ contribution
Study conception and design: DJP, IC, IG, MH. Data acquisition: DJP, IG, MH. Analysis and interpretation of data: DJP, IC, IG, MH. Drafting of the manuscript: DJP, IC, IG, MH. Significant manuscript review with significant intellectual involvement: DJP, IC, IG, MH. The final version has been read and approved by all authors.
Authors’ ORCID IDs
Dorina Jovmir-Popa – https://orcid.org/0000-0002-3187-6801
Ion Codreanu – https://orcid.org/0000-0002-2644-5572
Igor Gavrilașenco – https://orcid.org/0000-0003-1418-6515
Marina Harea – https://orcid.org/0000-0001-7681-9467
References
Katanoda K, Saito E. Laryngeal cancer incidence rates in the world from the Cancer Incidence in Five Continents XI. Jpn J Clin Oncol. 2019;49(1):100-101. doi: 10.1093/jjco/hyy193.
Ţîbîrnă G, Darii V, Postolache A; [Ministry of Health of the Republic of Moldova]. Cancerul laringian: Protocol clinic naţional (PCN-178) [Laryngeal cancer: National clinical protocol (NCP-178)] [Internet]. Chisinau: The Ministry; 2012 [cited 2022 Dec 12]. Available from: https://msmps.gov.md/wp-content/uploads/2020/07/13954-PCN-17820Cancerul20laringean.pdf. Romanian.
Ţîbîrnă G, Darii V, Stratan V, Cojocaru C, et al. Optimizarea tratamentului multimodal al cancerului laringian în baza evidenţii particularităţilor clinicomorfoimunologice [The multimodal optimization treatment of laryngeal cancer in base of clinical morphological and immunological particularities]. [Bull Acad Sci Mold. Med Sci]. 2019;(4/64):89-97. Romanian.
Jovmir-Popa D. Algoritmul de diagnostic renghenologic pentru pacienții suspecţi cu cancer de laringe [Renghenological diagnostic algorithm for suspected patients with laryngeal cancer]. [Bull Acad Sci Mold. Med Sci]. 2020;(4/68):350-353. Romanian.
Bootz F. Guideline on diagnosis, treatment, and follow-up of laryngeal cancer. Radiologe. 2020;60(11):1052-1057. doi: 10.1007/s00117-020-00760-9.
Tamaki A, Miles BA, Lango M, Kowalski L, Zender CA. AHNS Series: Do you know your guidelines? Review of current knowledge on laryngeal cancer. Head Neck. 2018;40(1):170-181. doi: 10.1002/hed.24862.
Jovmir-Popa D. Rolul imagisticii în diagnosticul cancerului de laringe, posibilități și perspective [The role of imaging in the diagnosis of laryngeal cancer, possibilities and perspectives]. [Bull Acad Sci Mold. Med Sci]. 2017;(4/56):109-116. Romanian.
Joshi VM, Wadhwa V, Mukherji SK. Imaging in laryngeal cancers. Indian J Radiol Imaging. 2012;22(3):209-226. doi: 10.4103/0971-3026.107183.
Bozzato A, Pillong L, Schick B, Lell M. M. Current diagnostic imaging and treatment planning for laryngeal cancer. Radiologe. 2020;60(11):1026-1037. doi: 10.1007/s00117-020-00757-4.
Ferrari A, Bertolaccini L, Solli P, Di Salvia PO, Scaradozzi D. Digital chest tomosynthesis: the 2017 updated review of an emerging application. Ann Transl Med. 2018;6(5):91. doi: 10.21037/atm.2017.08.18.
Hadadi I, Rae W, Clarke J, McEntee M, Ekpo E. Breast cancer detection: comparison of digital mammography and digital breast tomosynthesis across non-dense and dense breasts. Radiography (London). 2021;27(4):1027-1032. doi: 10.1016/j.radi.2021.04.002.
Hooley RJ, Durand MA, Philpotts LE. Advances in digital breast tomosynthesis. AJR Am J Roentgenol. 2017;208(2):256-266. doi: 10.2214/AJR.16.17127.
Kruamak T, Edwards R, Cheng S, Hippe DS, Raghu G, Pipavath SNJ. Accuracy of digital tomosynthesis of the chest in detection of interstitial lung disease comparison with digital chest radiography. J Comput Assist Tomogr. 2019;43(1):109-114. doi: 10.1097/RCT.0000000000000780.
Meltzer C, Vikgren J, Bergman B, Molnar D, Norrlund RR, Hassoun A, Gottfridsson B, Bath M, Johnsson AA. Detection and characterization of solid pulmonary nodules at digital chest tomosynthesis: data from a cohort of the pilot Swedish cardiopulmonary bioimage study. Radiology. 2018;287(3):1018-1027. doi: 10.1148/radiol.2018171481.
Chen HY, Wu T, Tseng SP, Lin CY, Chen CW, Wong TH, Wei YF, Chen YF. Application of tomosynthesis for vertebral compression fracture diagnosis and bone healing assessment in fracture liaison services. Front Med. (Lausanne). 2022;9:910130. doi: 10.3389/fmed.2022.910130.
MedCalc statistical software. Concordance correlation coefficient [Internet]. Ostend: MedCalc Software Ltd; 2023- [cited 2023 Jan 2]. Available from: https://www.medcalc.org/manual/concordance.php
MedCalc statistical software. Mountain plot [Internet]. Ostend: MedCalc Software Ltd; 2023- [cited 2023 Jan 2]. Available from: https://www.medcalc.org/manual/mountain-plot.php
Machida H, Yuhara T, Tamura M, Ishikawa T, Tate E, Ueno E, Nye K, Sabol JM. Whole-body clinical applications of digital tomosynthesis. Radiographics. 2016;36(3):735-750. doi: 10.1148/rg.2016150184.
Langer SG, Graner BD, Schueler BA, Fetterly KA, Kofler JM, Mandrekar JN, Bartholmai BJ. Sensitivity of thoracic digital tomosynthesis (DTS) for the identification of lung nodules. J Digit Imaging. 2016;29(1):141-147. doi: 10.1007/s10278-015-9818-0.
Vult von Steyern K, Bjorkman-Burtscher IM, Weber L, Hoglund P, Geijer M. Effective dose from chest tomosynthesis in children. Radiat Prot Dosimetry. 2014;158(3):290-298. doi: 10.1093/rpd/nct224.
Tongkum S, Suwanpradit P, Vidhyarkorn S, Siripongsakun S, Oonsiri S, Rakvongthai Y, Khamwan K. Determination of radiation dose and low-dose protocol for digital chest tomosynthesis using radiophotoluminescent (RPL) glass dosimeters. Phys Med. 2020;73:13-21. doi: 10.1016/j.ejmp.2020.03.024.
Chan S. Digital tomosynthesis applications in pediatric orthopedic imaging: a case series. Mo Med. 2018;115(4):344-348.
Sholohova N, Simonovskaya H, Zaytseva O, Olkhova E. Digital tomosynthesis in pediatric patients: opportunities and promises (Review). Georgian Med News. 2020;(309):151-156.
Caumo F, Romanucci G, Hunter K, Zorzi M, Brunelli S, Macaskill P, Houssami N. Comparison of breast cancers detected in the Verona screening program following transition to digital breast tomosynthesis screening with cancers detected at digital mammography screening. Breast Cancer Res Treat. 2018;170(2):391-397. doi: 10.1007/s10549-018-4756-4.
Phi XA, Tagliafico A, Houssami N, Greuter MJW, de Bock GH. Digital breast tomosynthesis for breast cancer screening and diagnosis in women with dense breasts: a systematic review and meta-analysis. BMC Cancer. 2018;18(1):380. doi: 10.1186/s12885-018-4263-3.